Avius Analysis
In-Depth Insights.
Data Science at Your Fingertips.
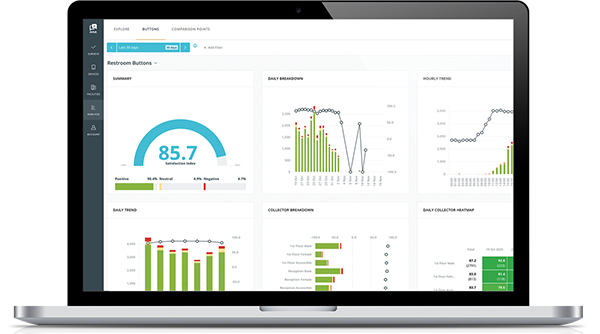
Turn large volumes of customer feedback and raw data into actionable insights with powerful filtering, advanced comparison tools, and AI-generated summaries - all designed to help your team make faster, more informed decisions.
EXECUTIVE-READY INSIGHTS IN JUST A FEW CLICKS
Advanced Data Exploration
Find the insights that matter most. Filter, segment, and compare feedback data by location, touchpoint, visitor type, and more to uncover trends and opportunities.
Meeting-Ready Insights
Spend less time preparing, more time improving. It's concise, benefit-led, and directly addresses a common pain point for managers who spend hours pulling data together before meetings.
AI-Powered Summaries
Understand the story behind the data. Instantly summarise customer sentiment, identify key themes, highlight operational gaps, and uncover opportunities for improvement.
ACCESSING ANALYSIS
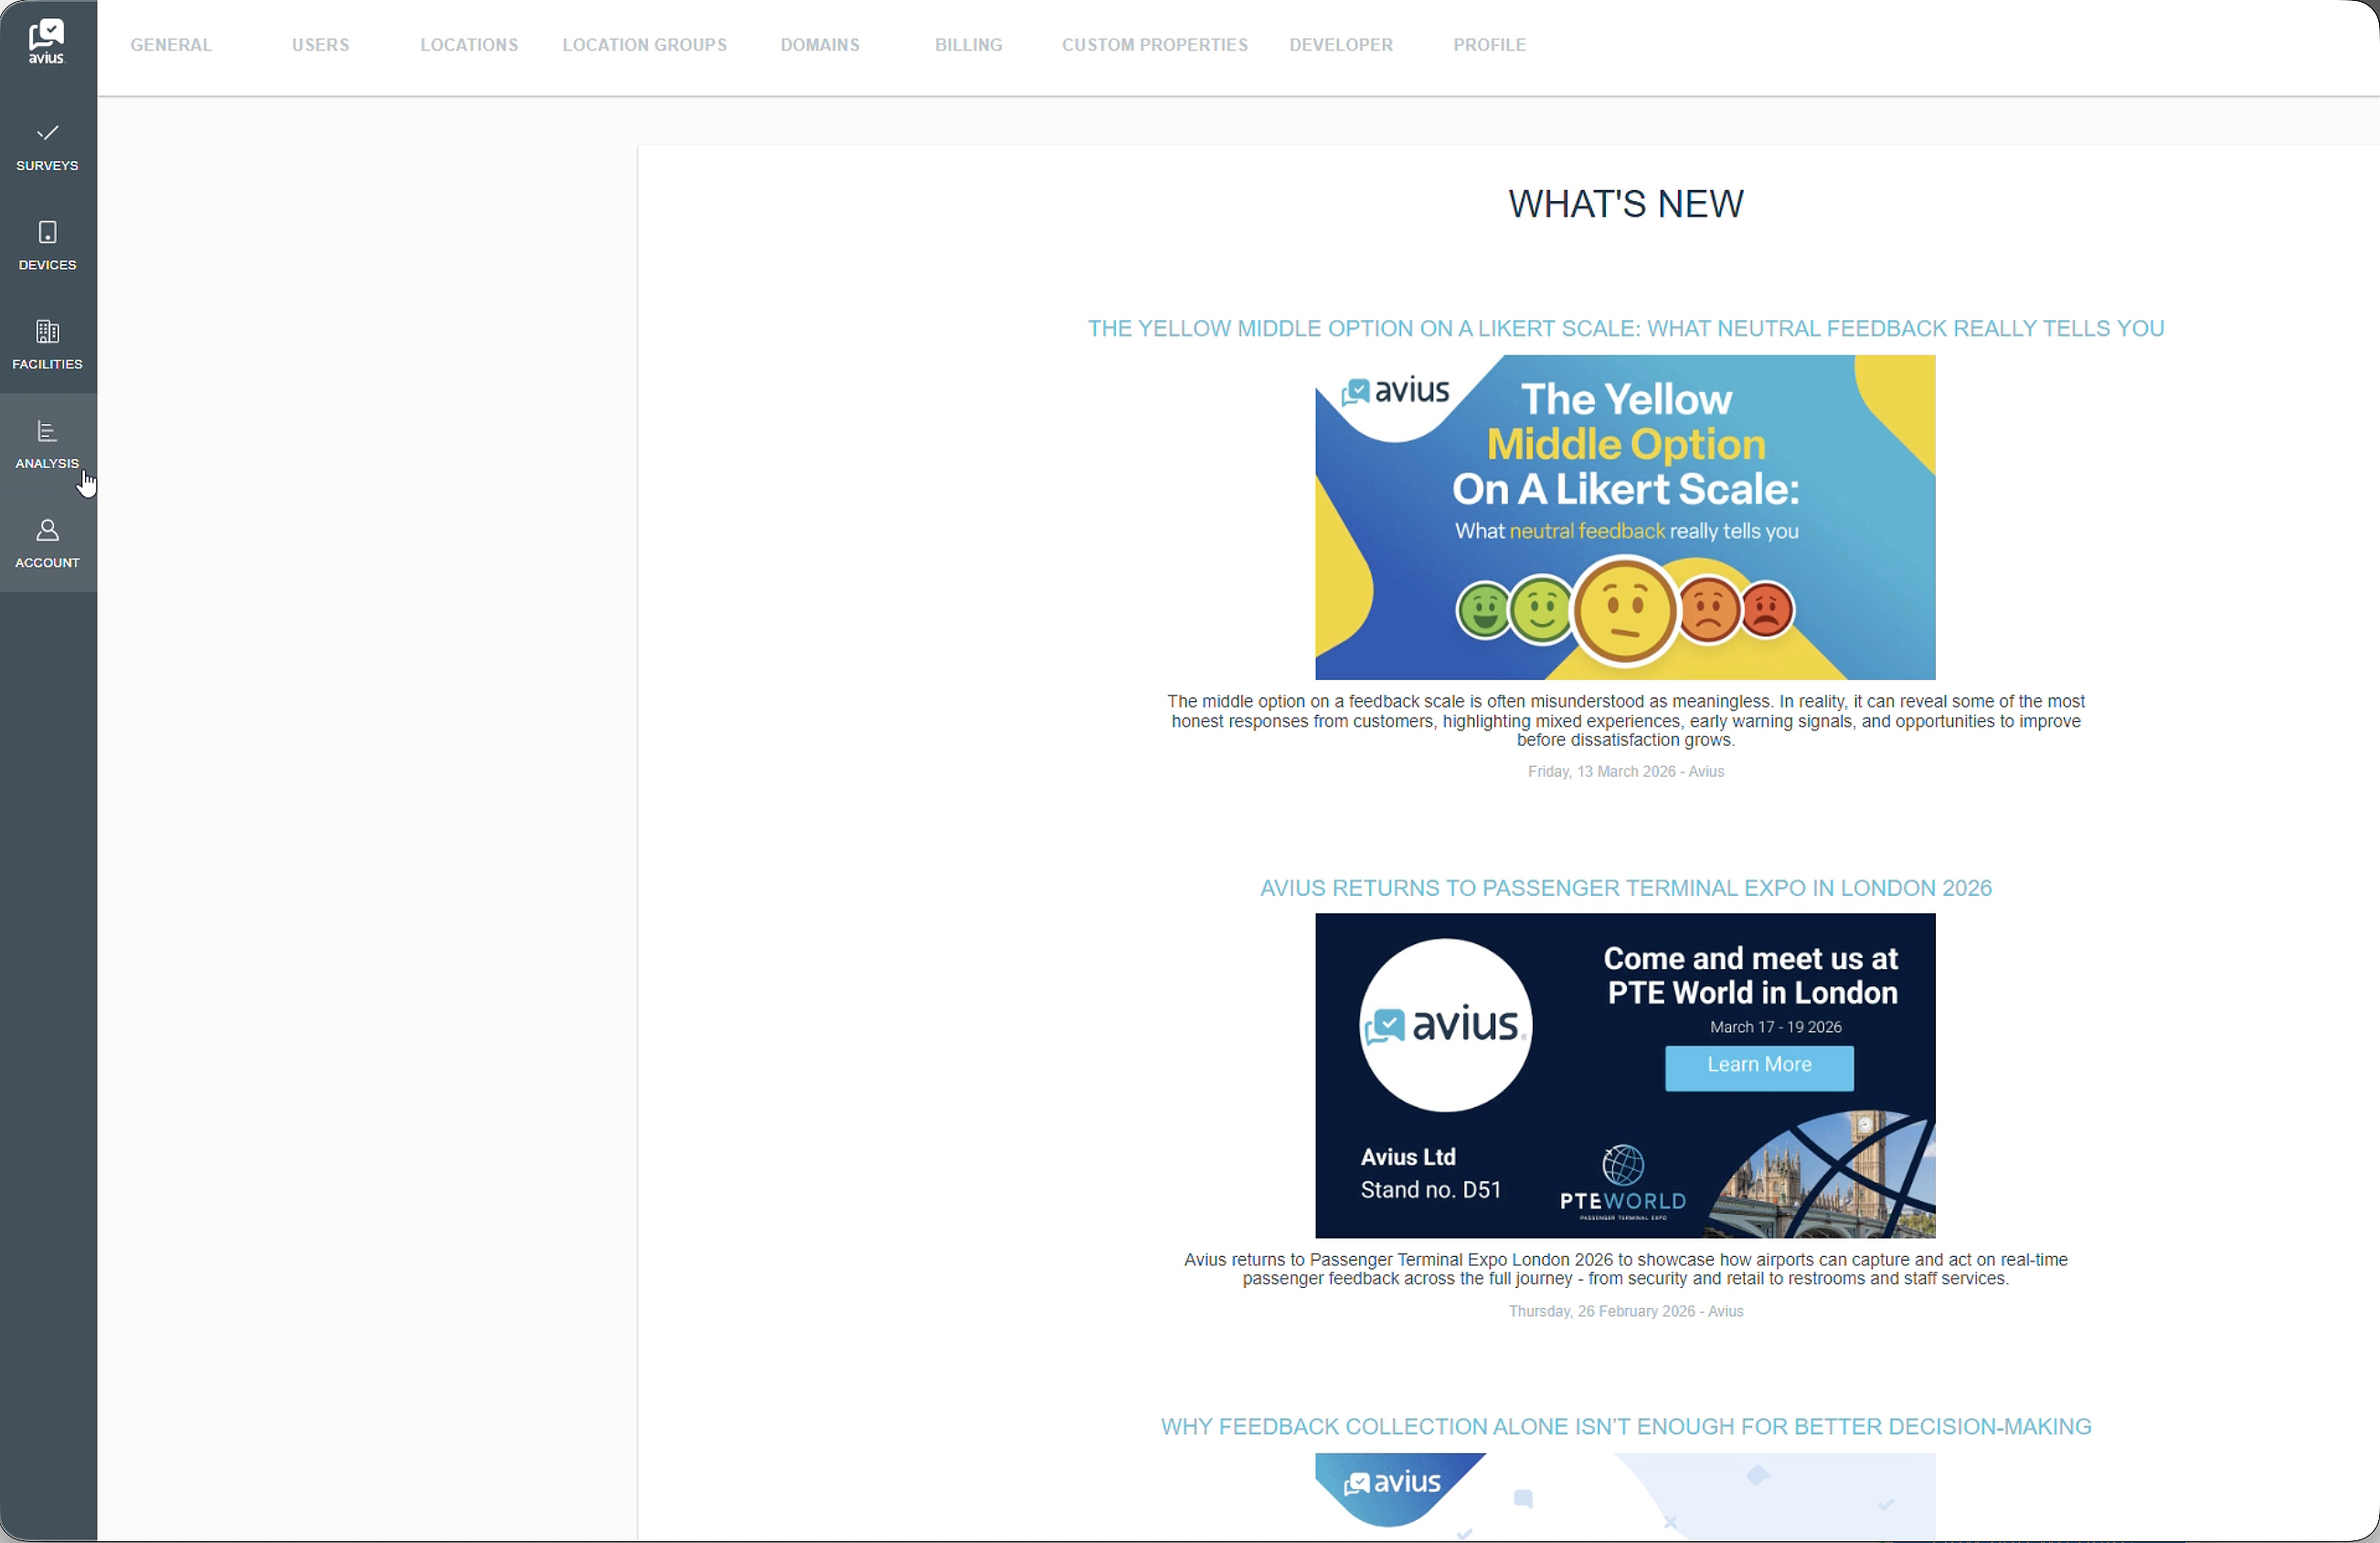
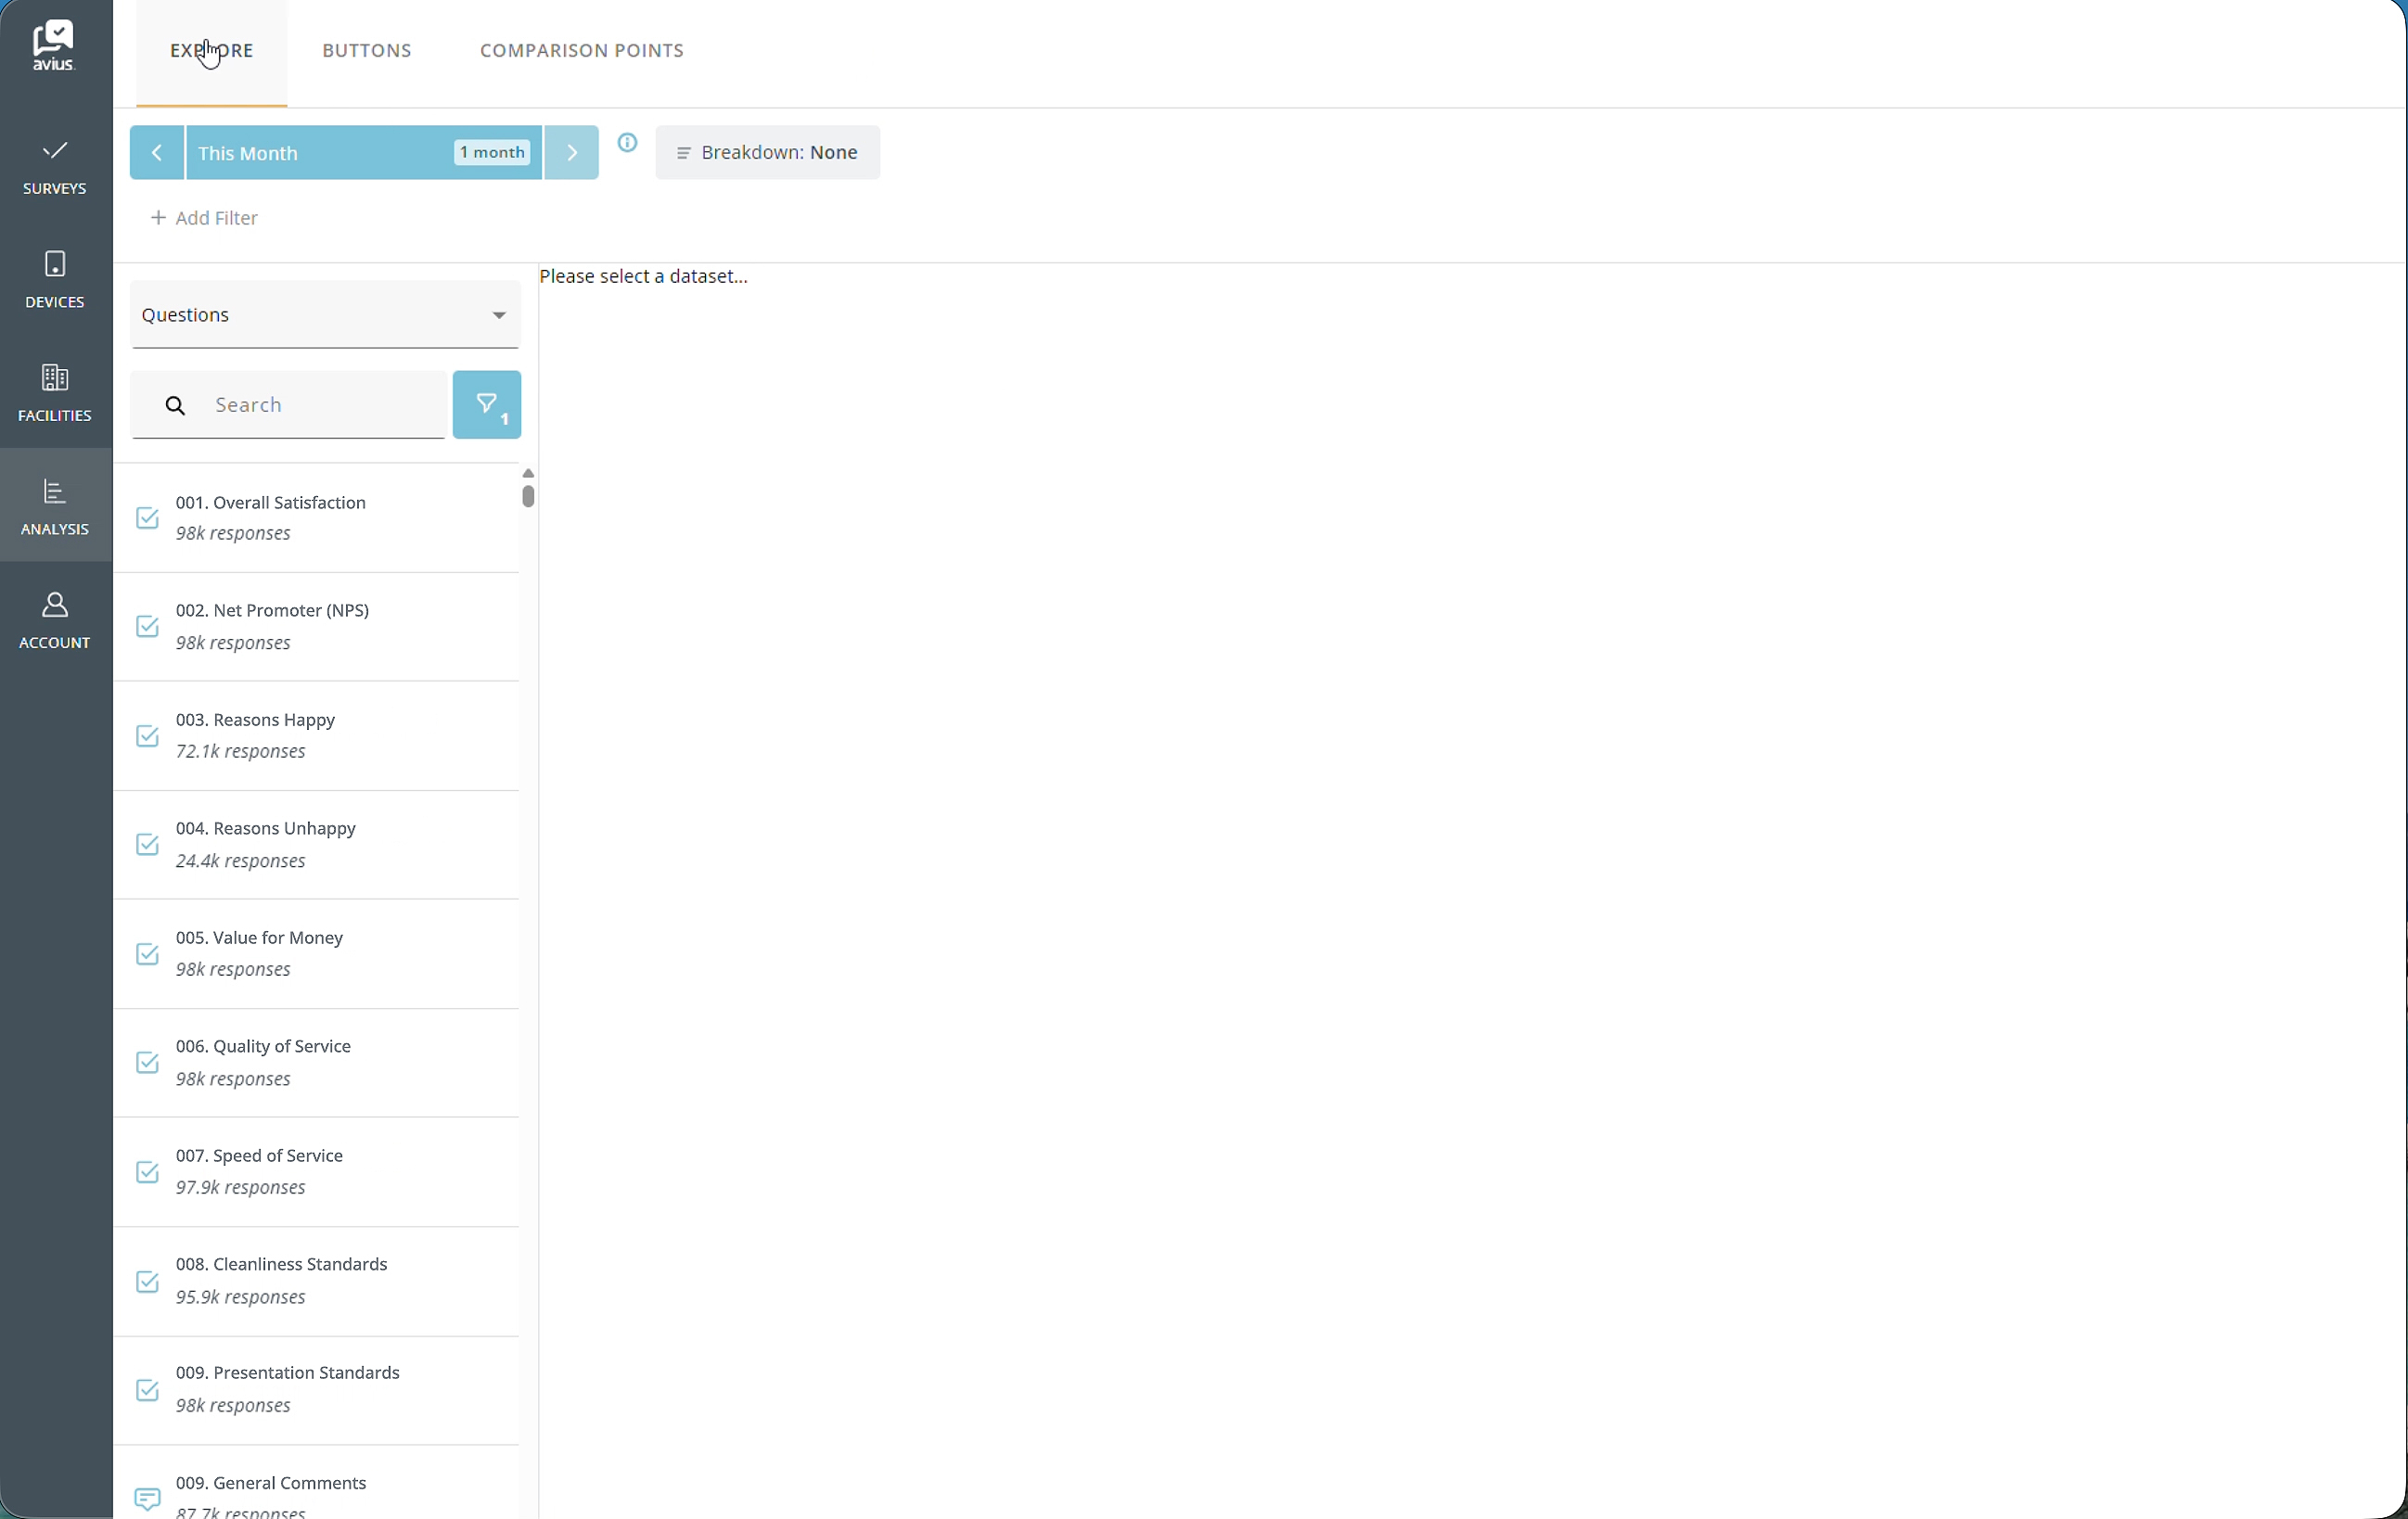
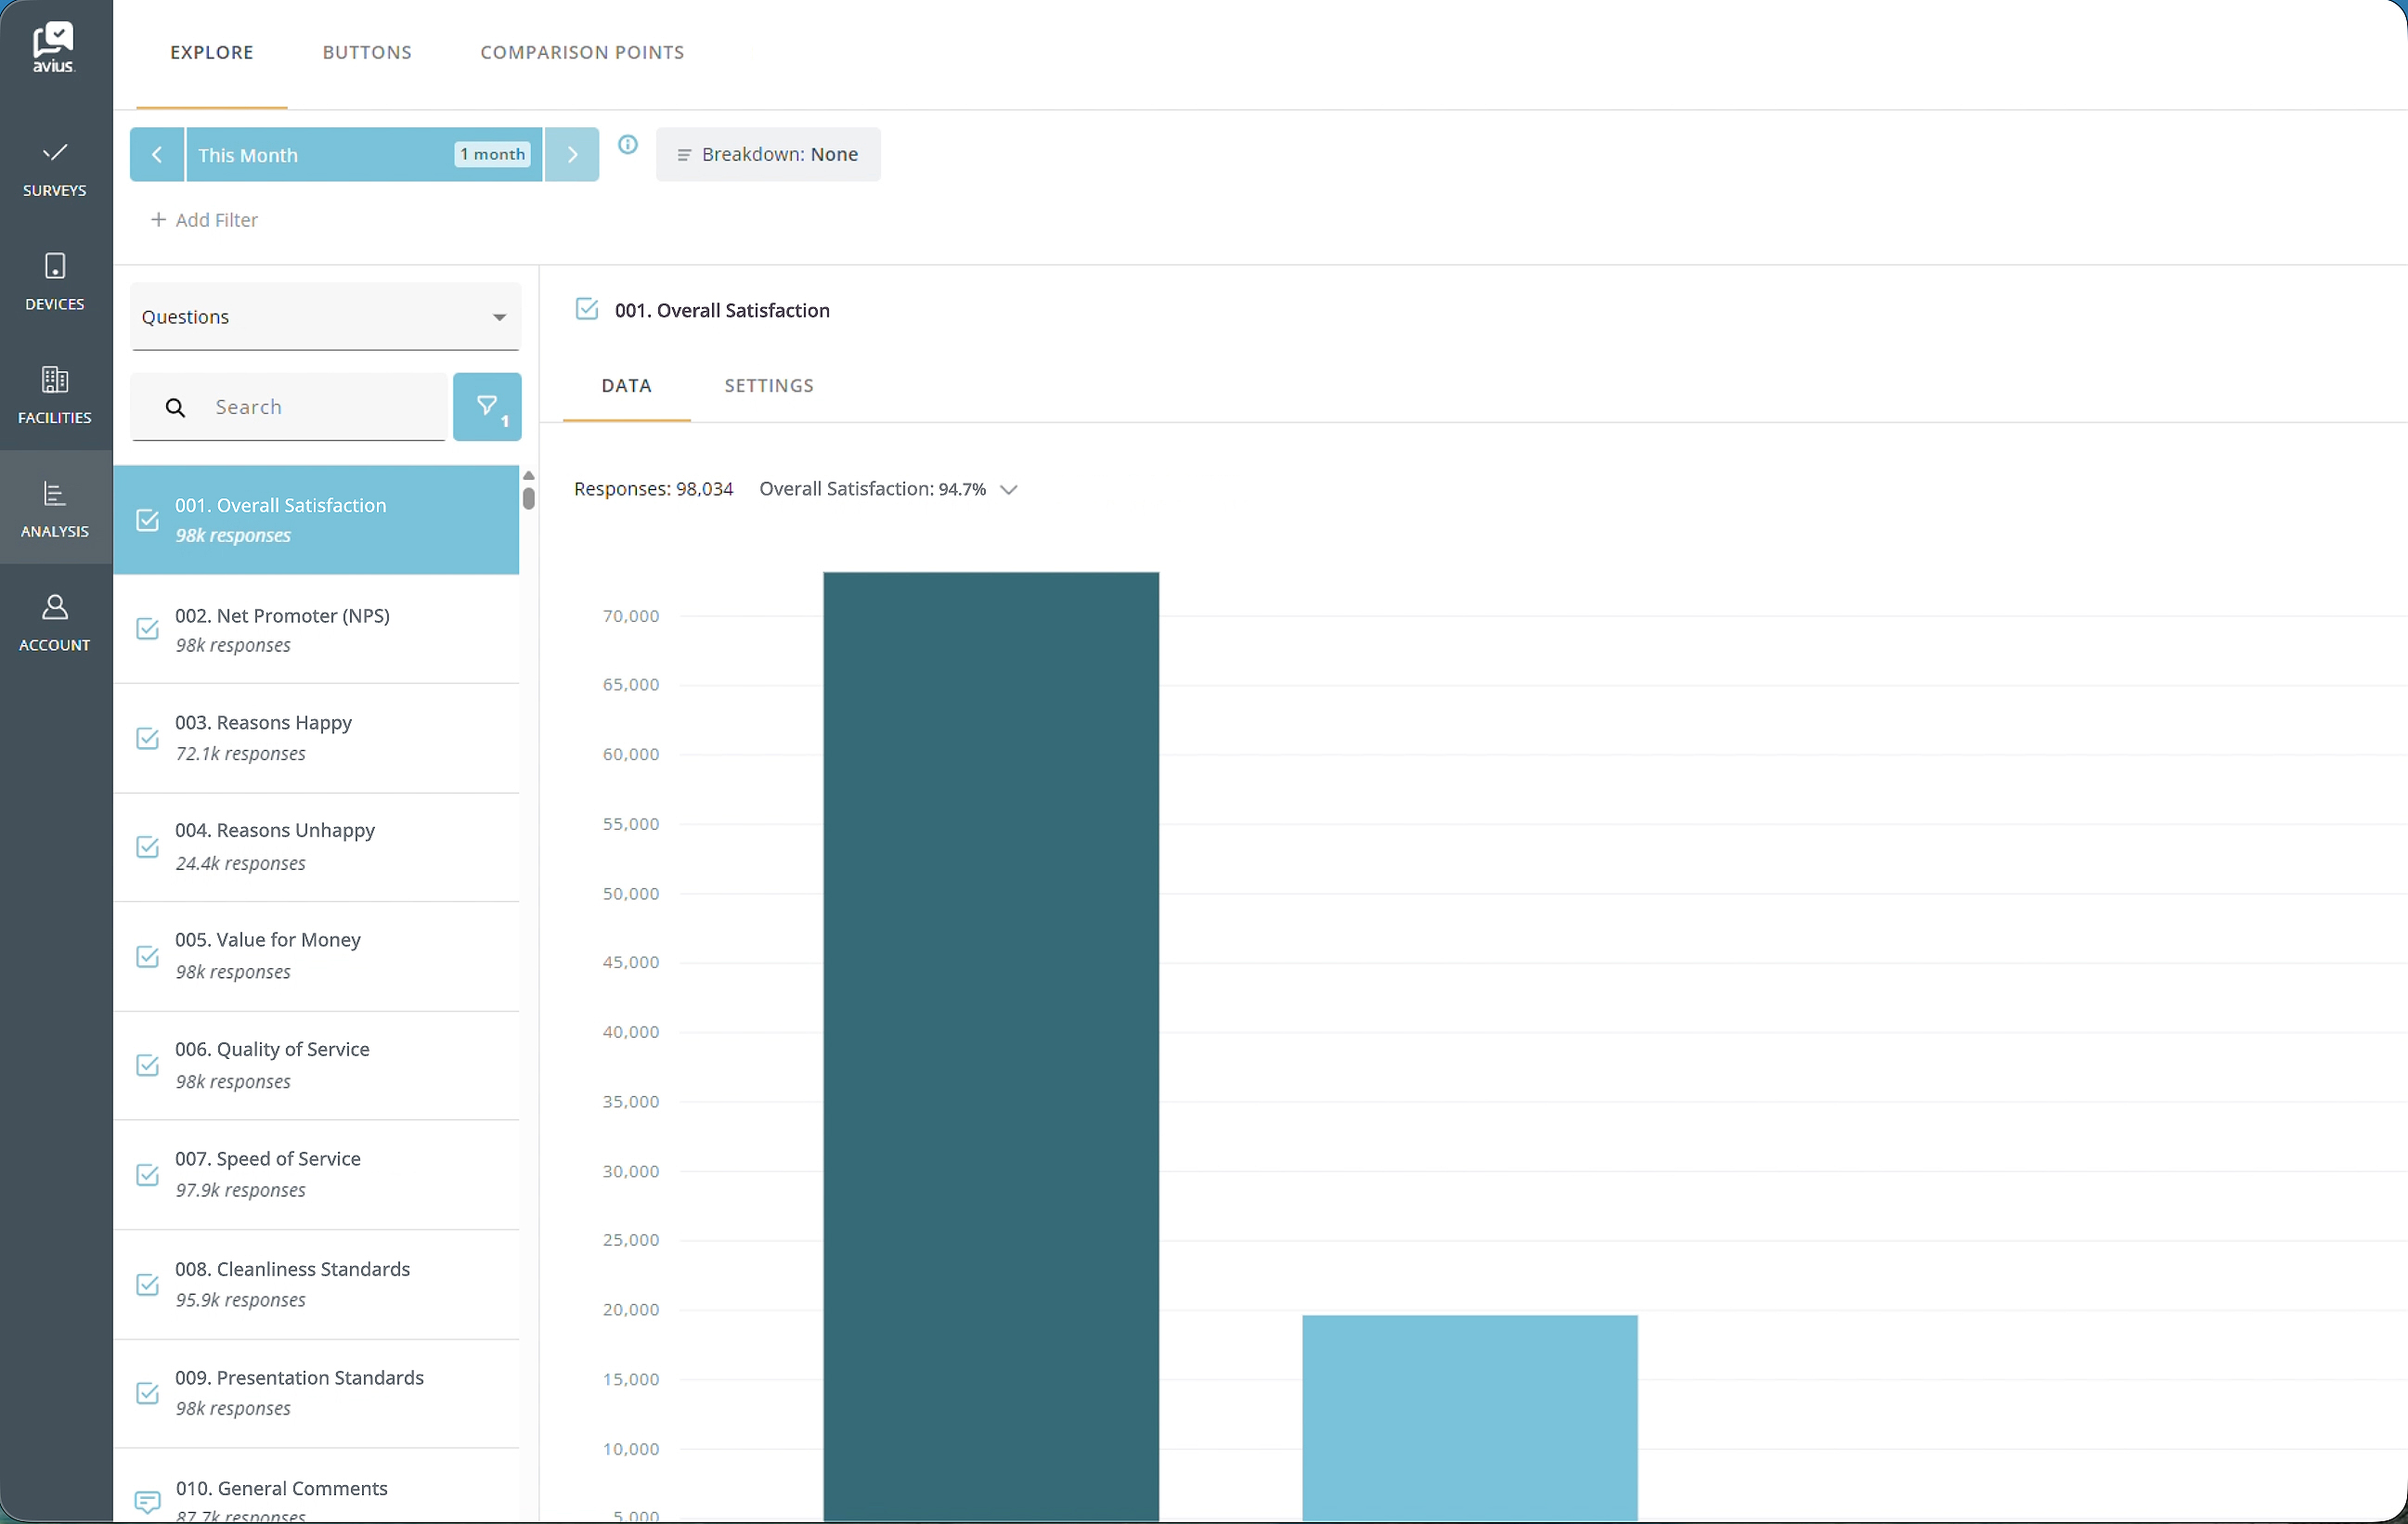
To access Analysis, go to the Avius home page and select the Analysis tab from the left-hand navigation menu. This will take you directly to the Analysis Explore home page, where you can view and analyse your available data.
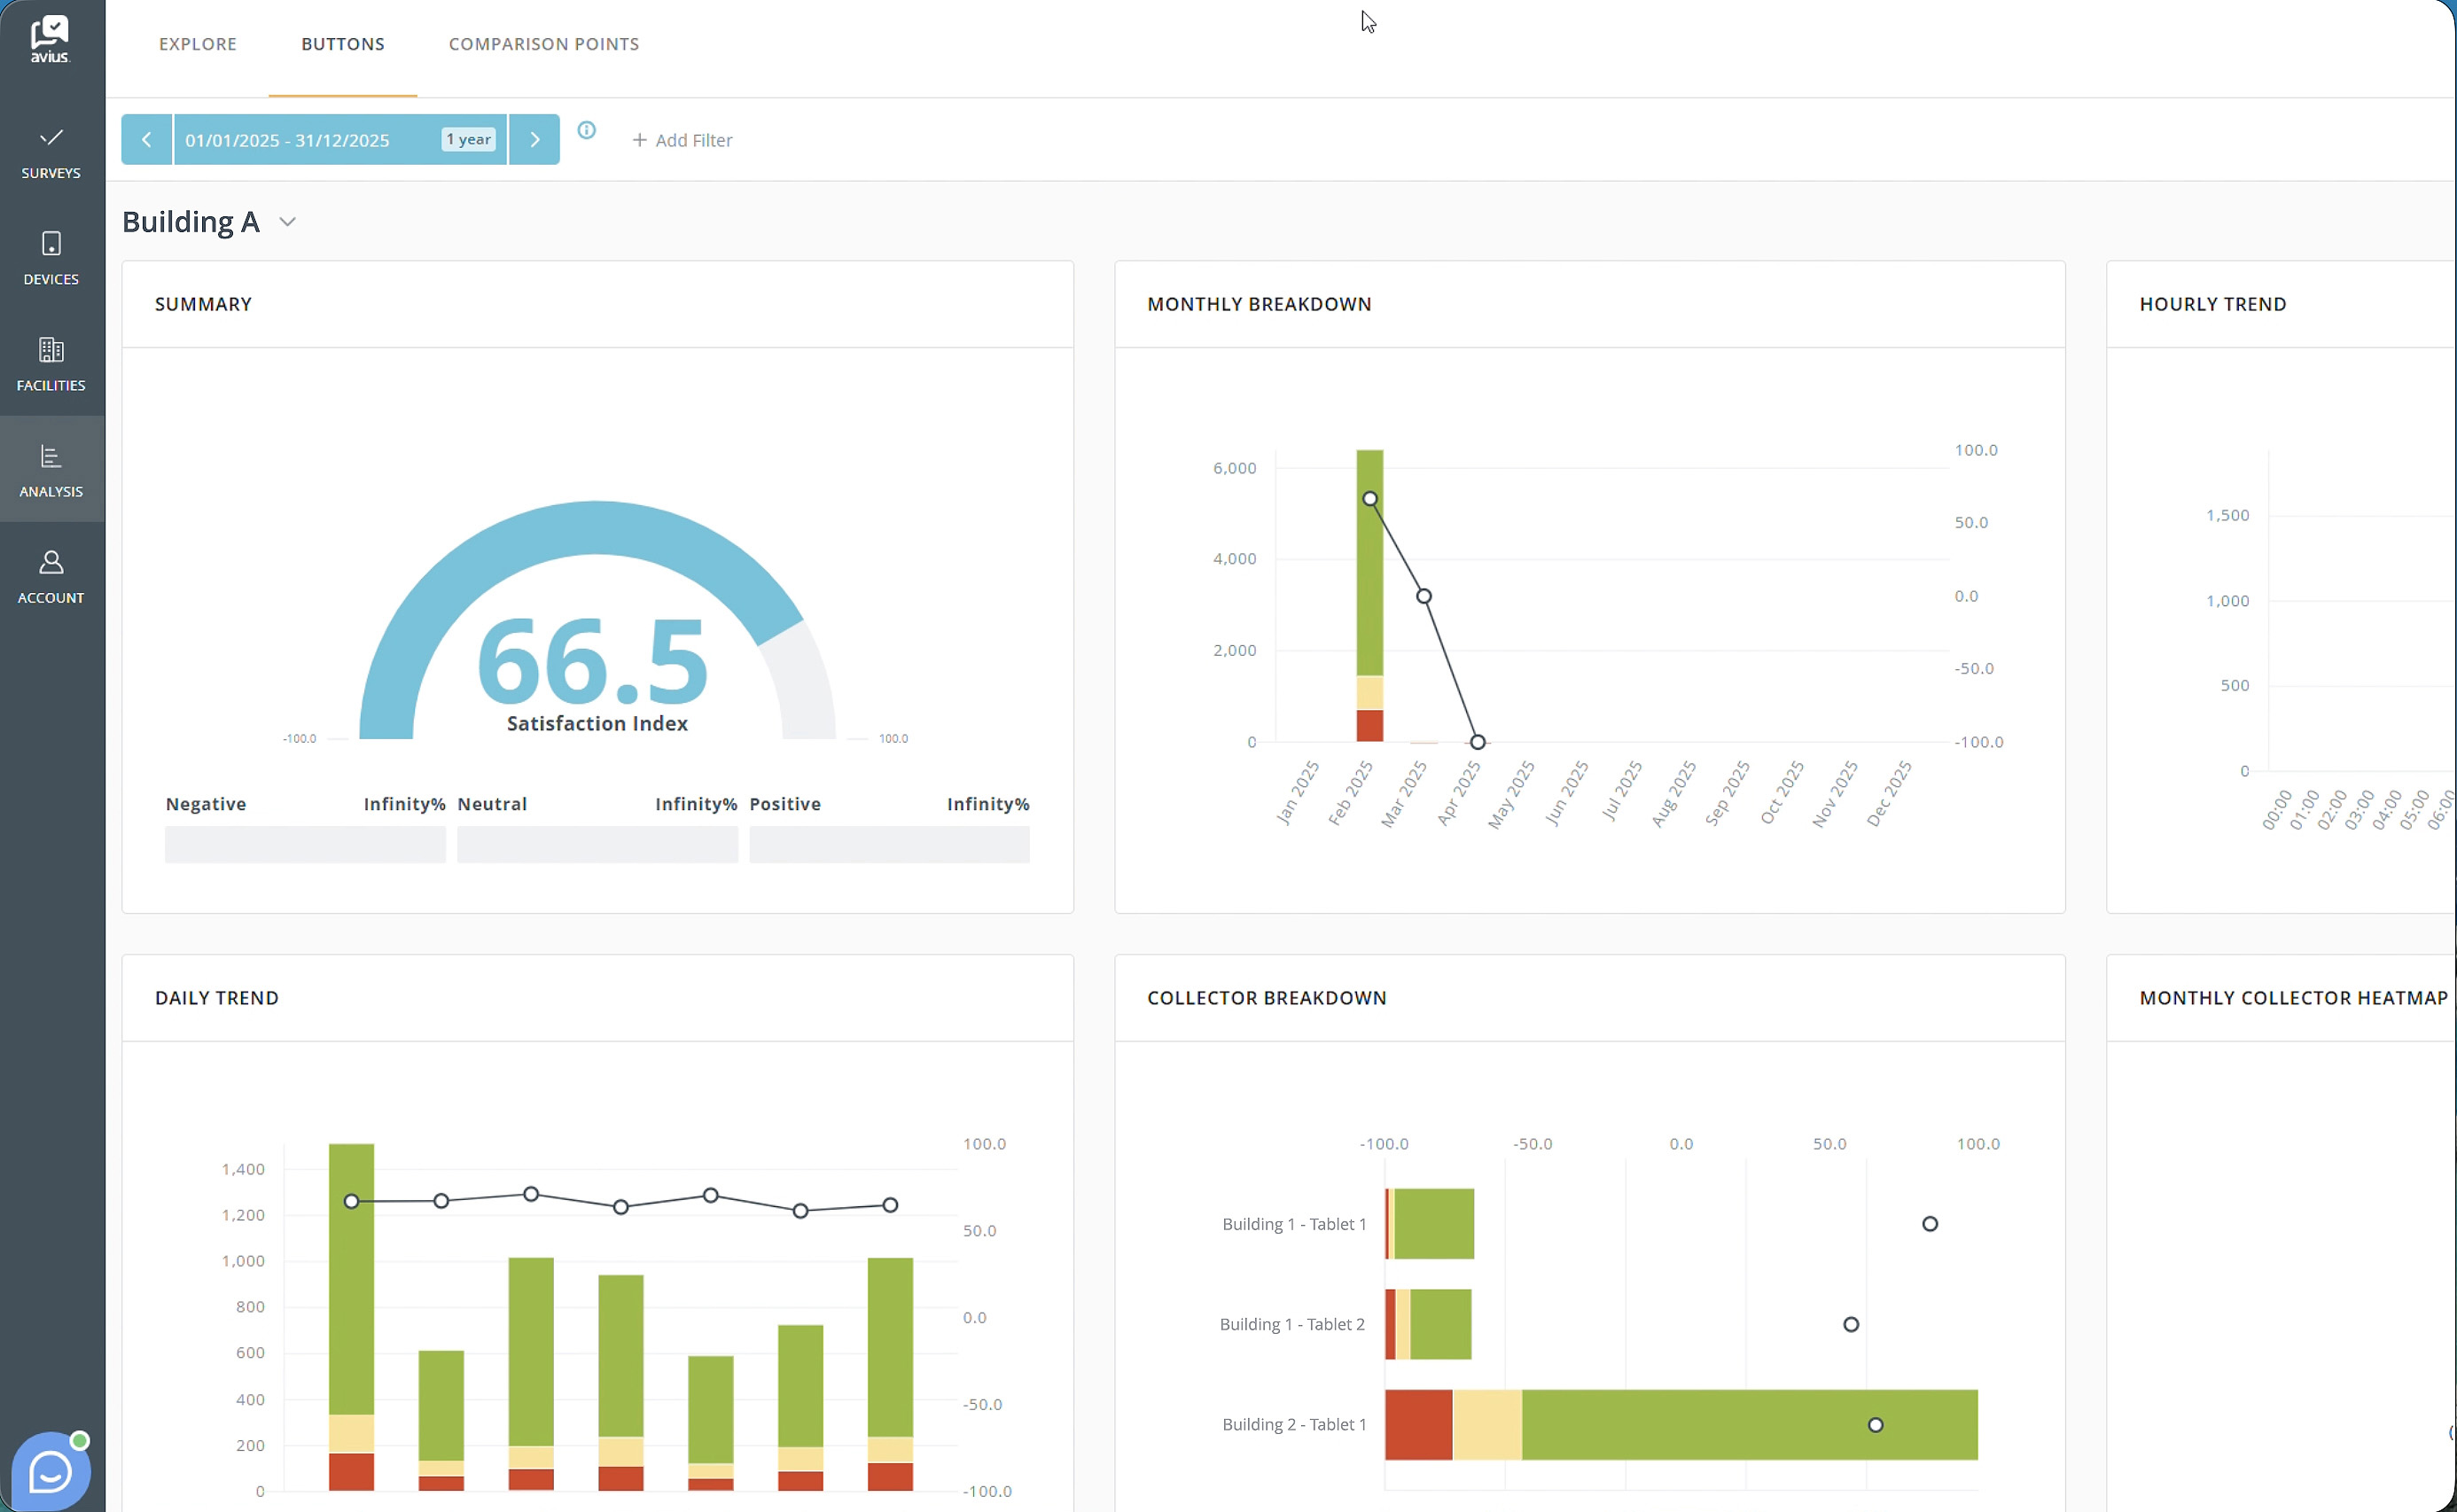
To view data from your button devices (where available), click Buttons at the top of the page to open the Analysis Buttons home page.
Click for more detail
Click for more detail
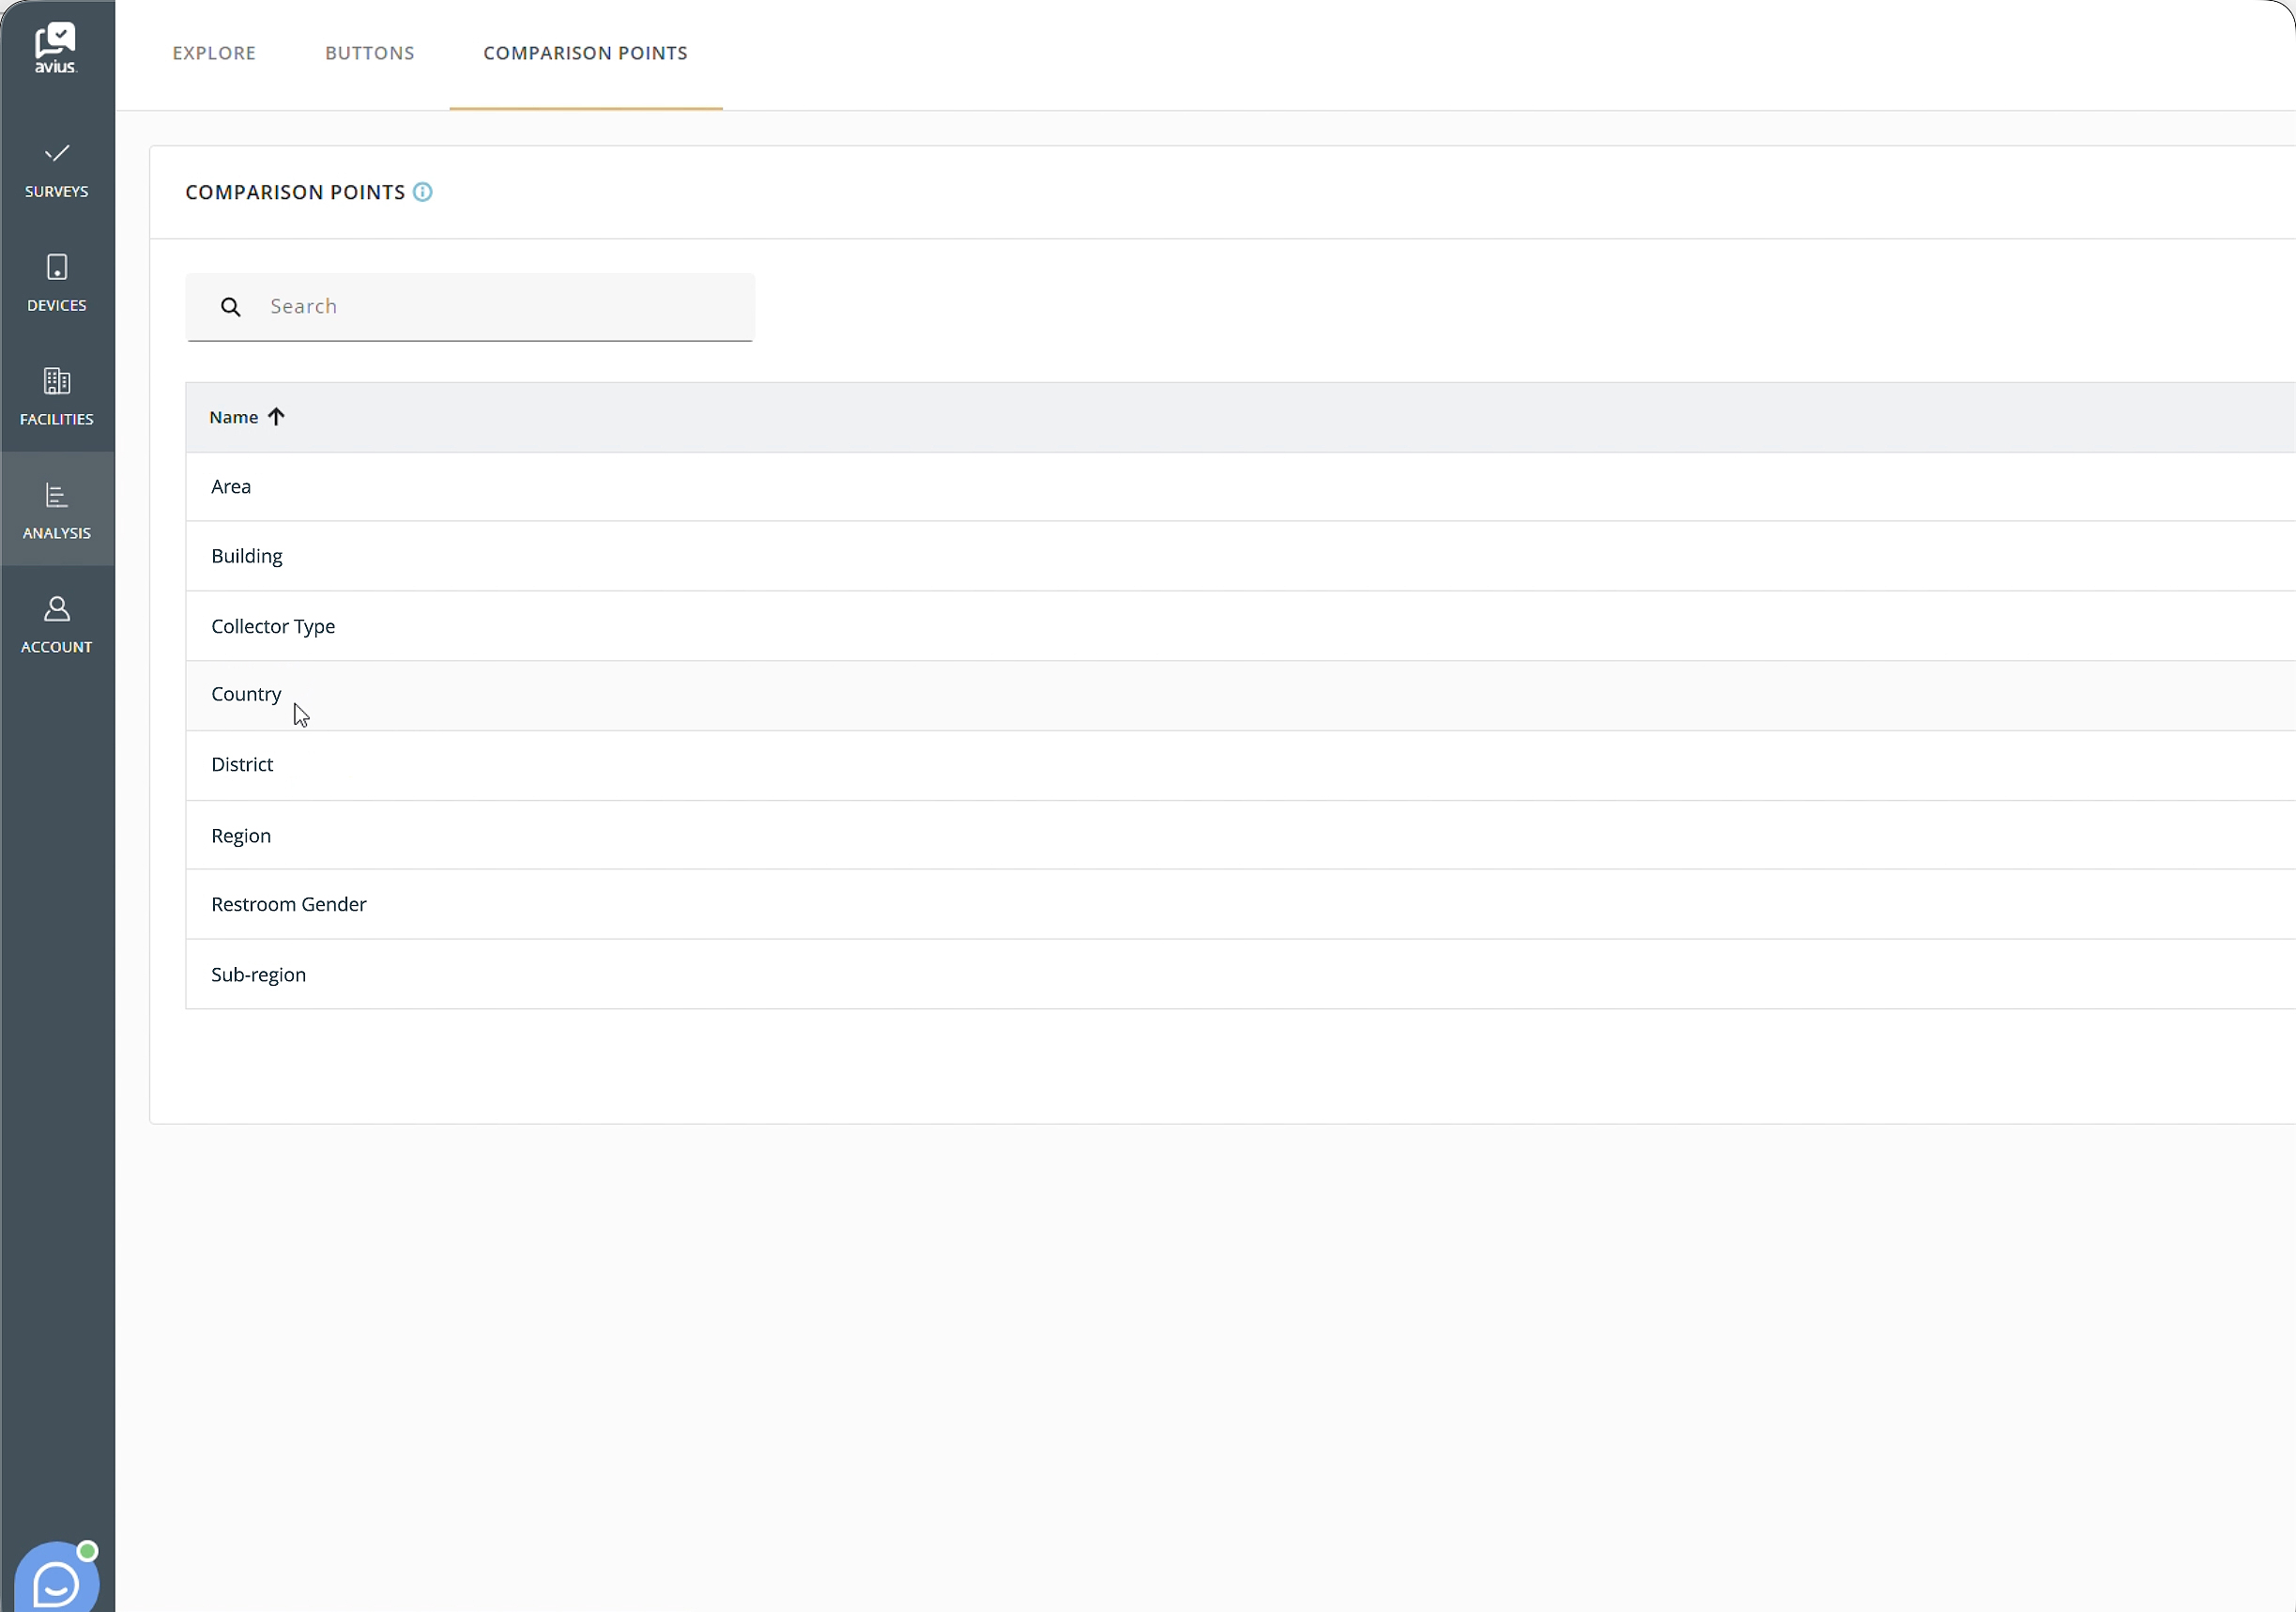
ACCESSING COMPARISON POINTS
From the Analysis home page, click the Comparison Points tab at the top of the screen to open the Comparison Points area.
Comparison Points allow you to group locations into custom categories, such as Region or Collector Type. These groups can then be used to provide additional breakdowns or filters and deeper analysis of your survey results
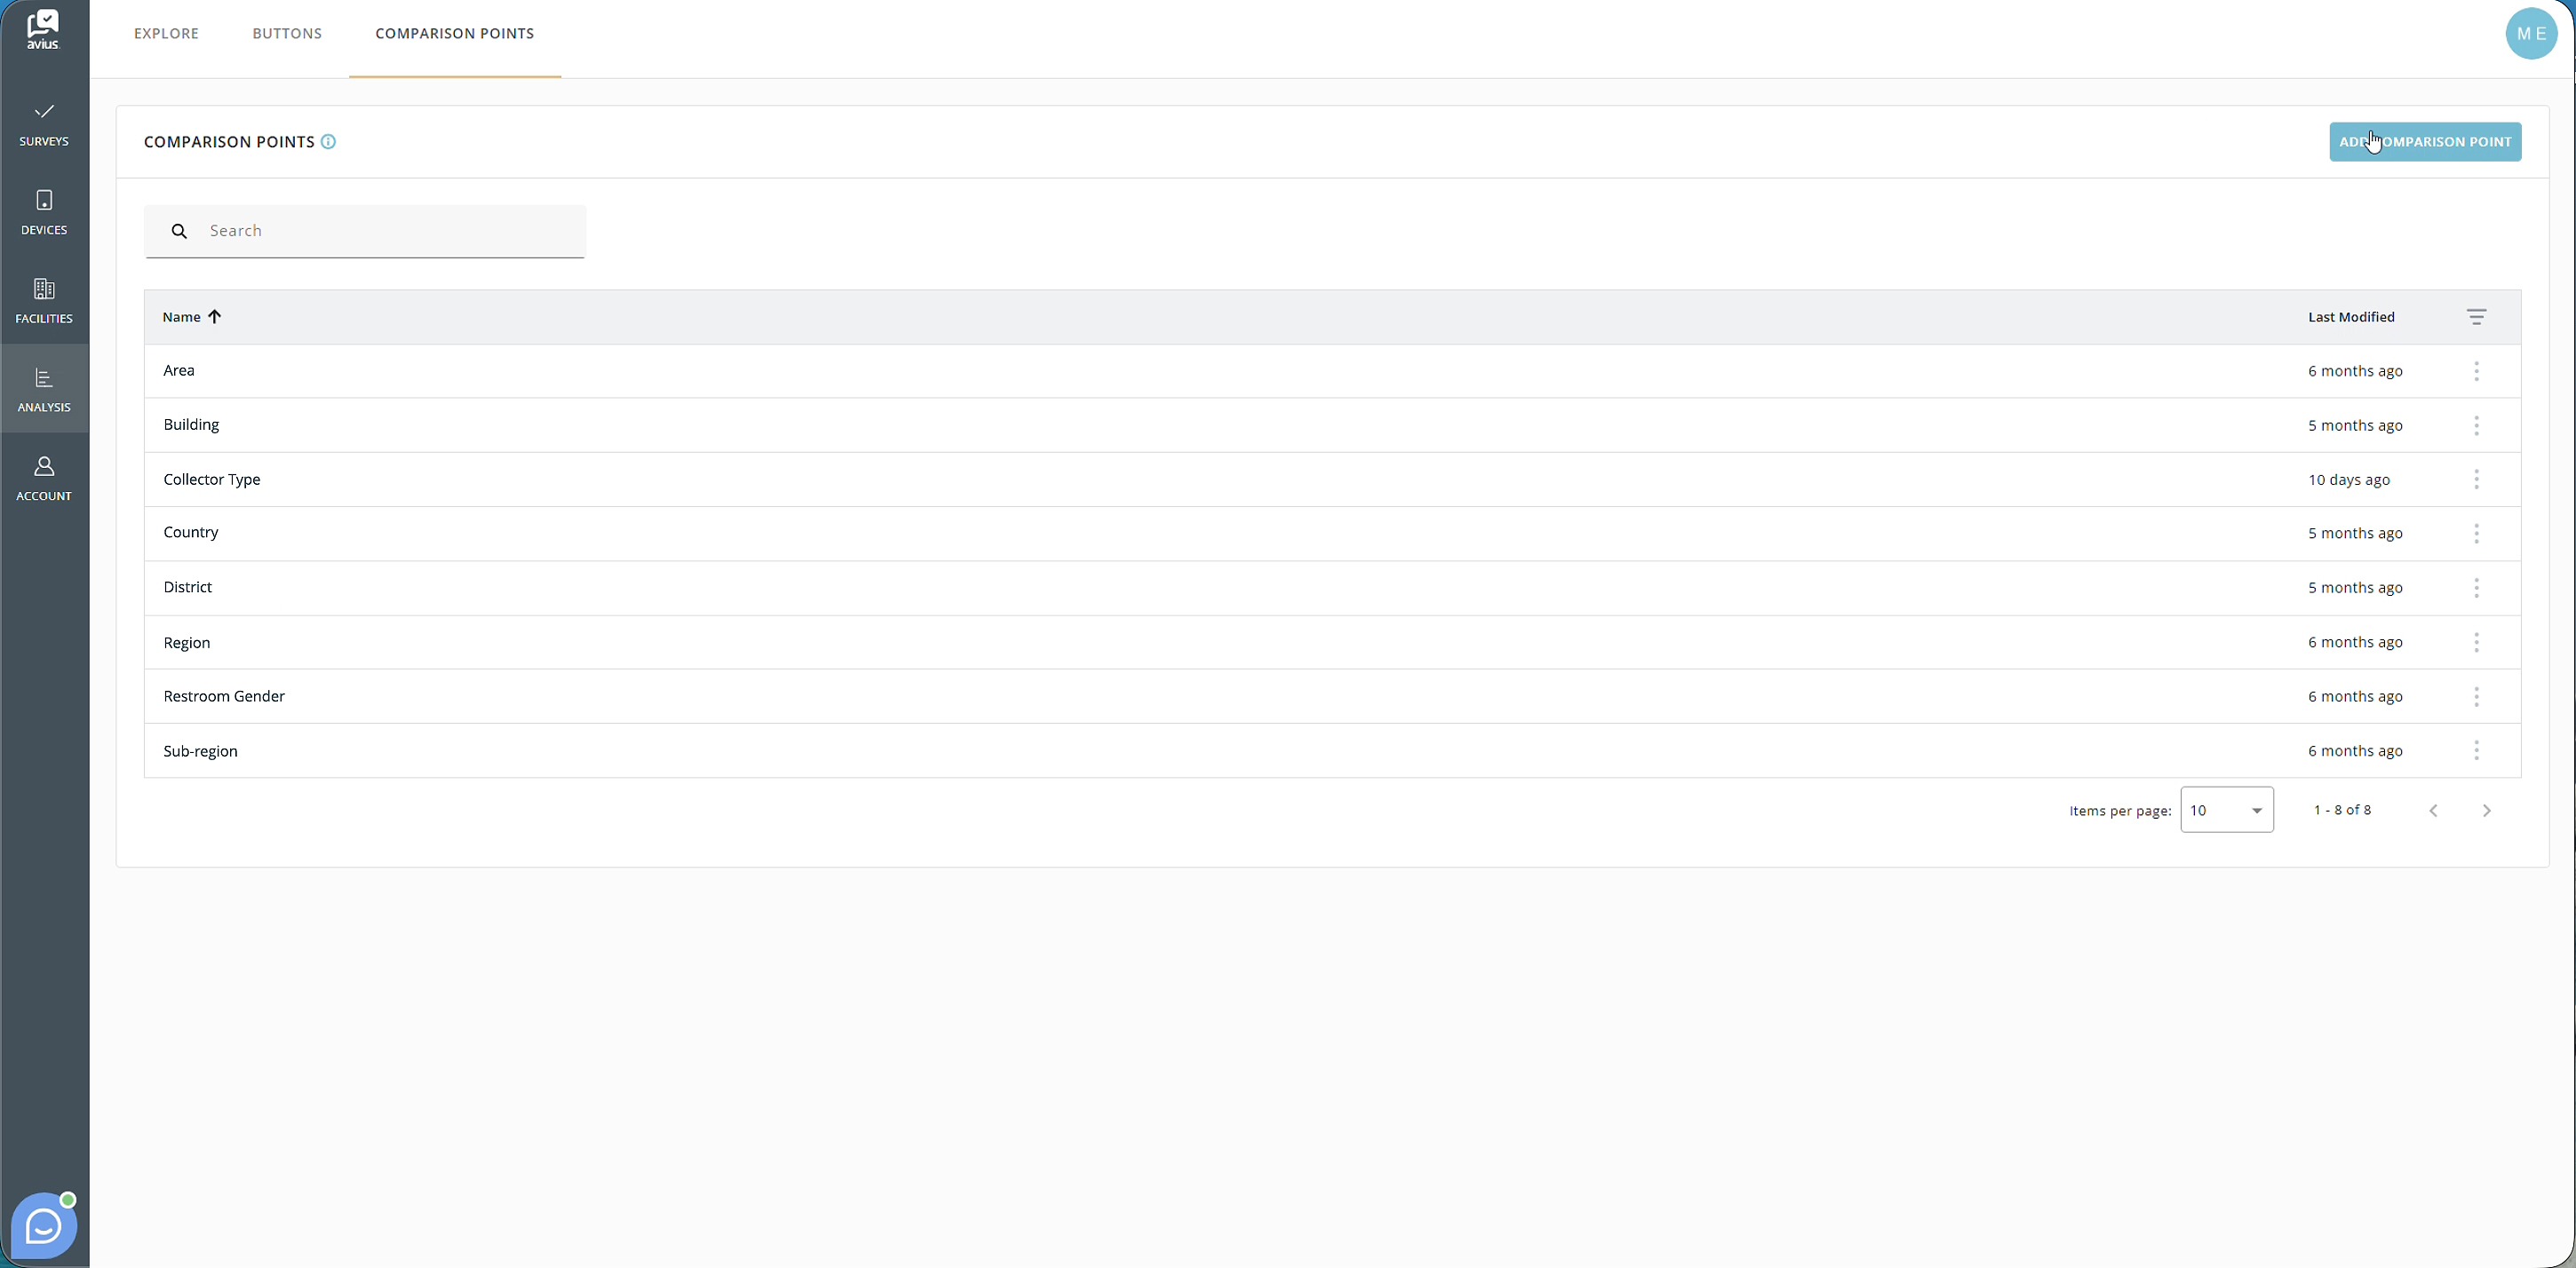
ADDING COMPARISON POINTS
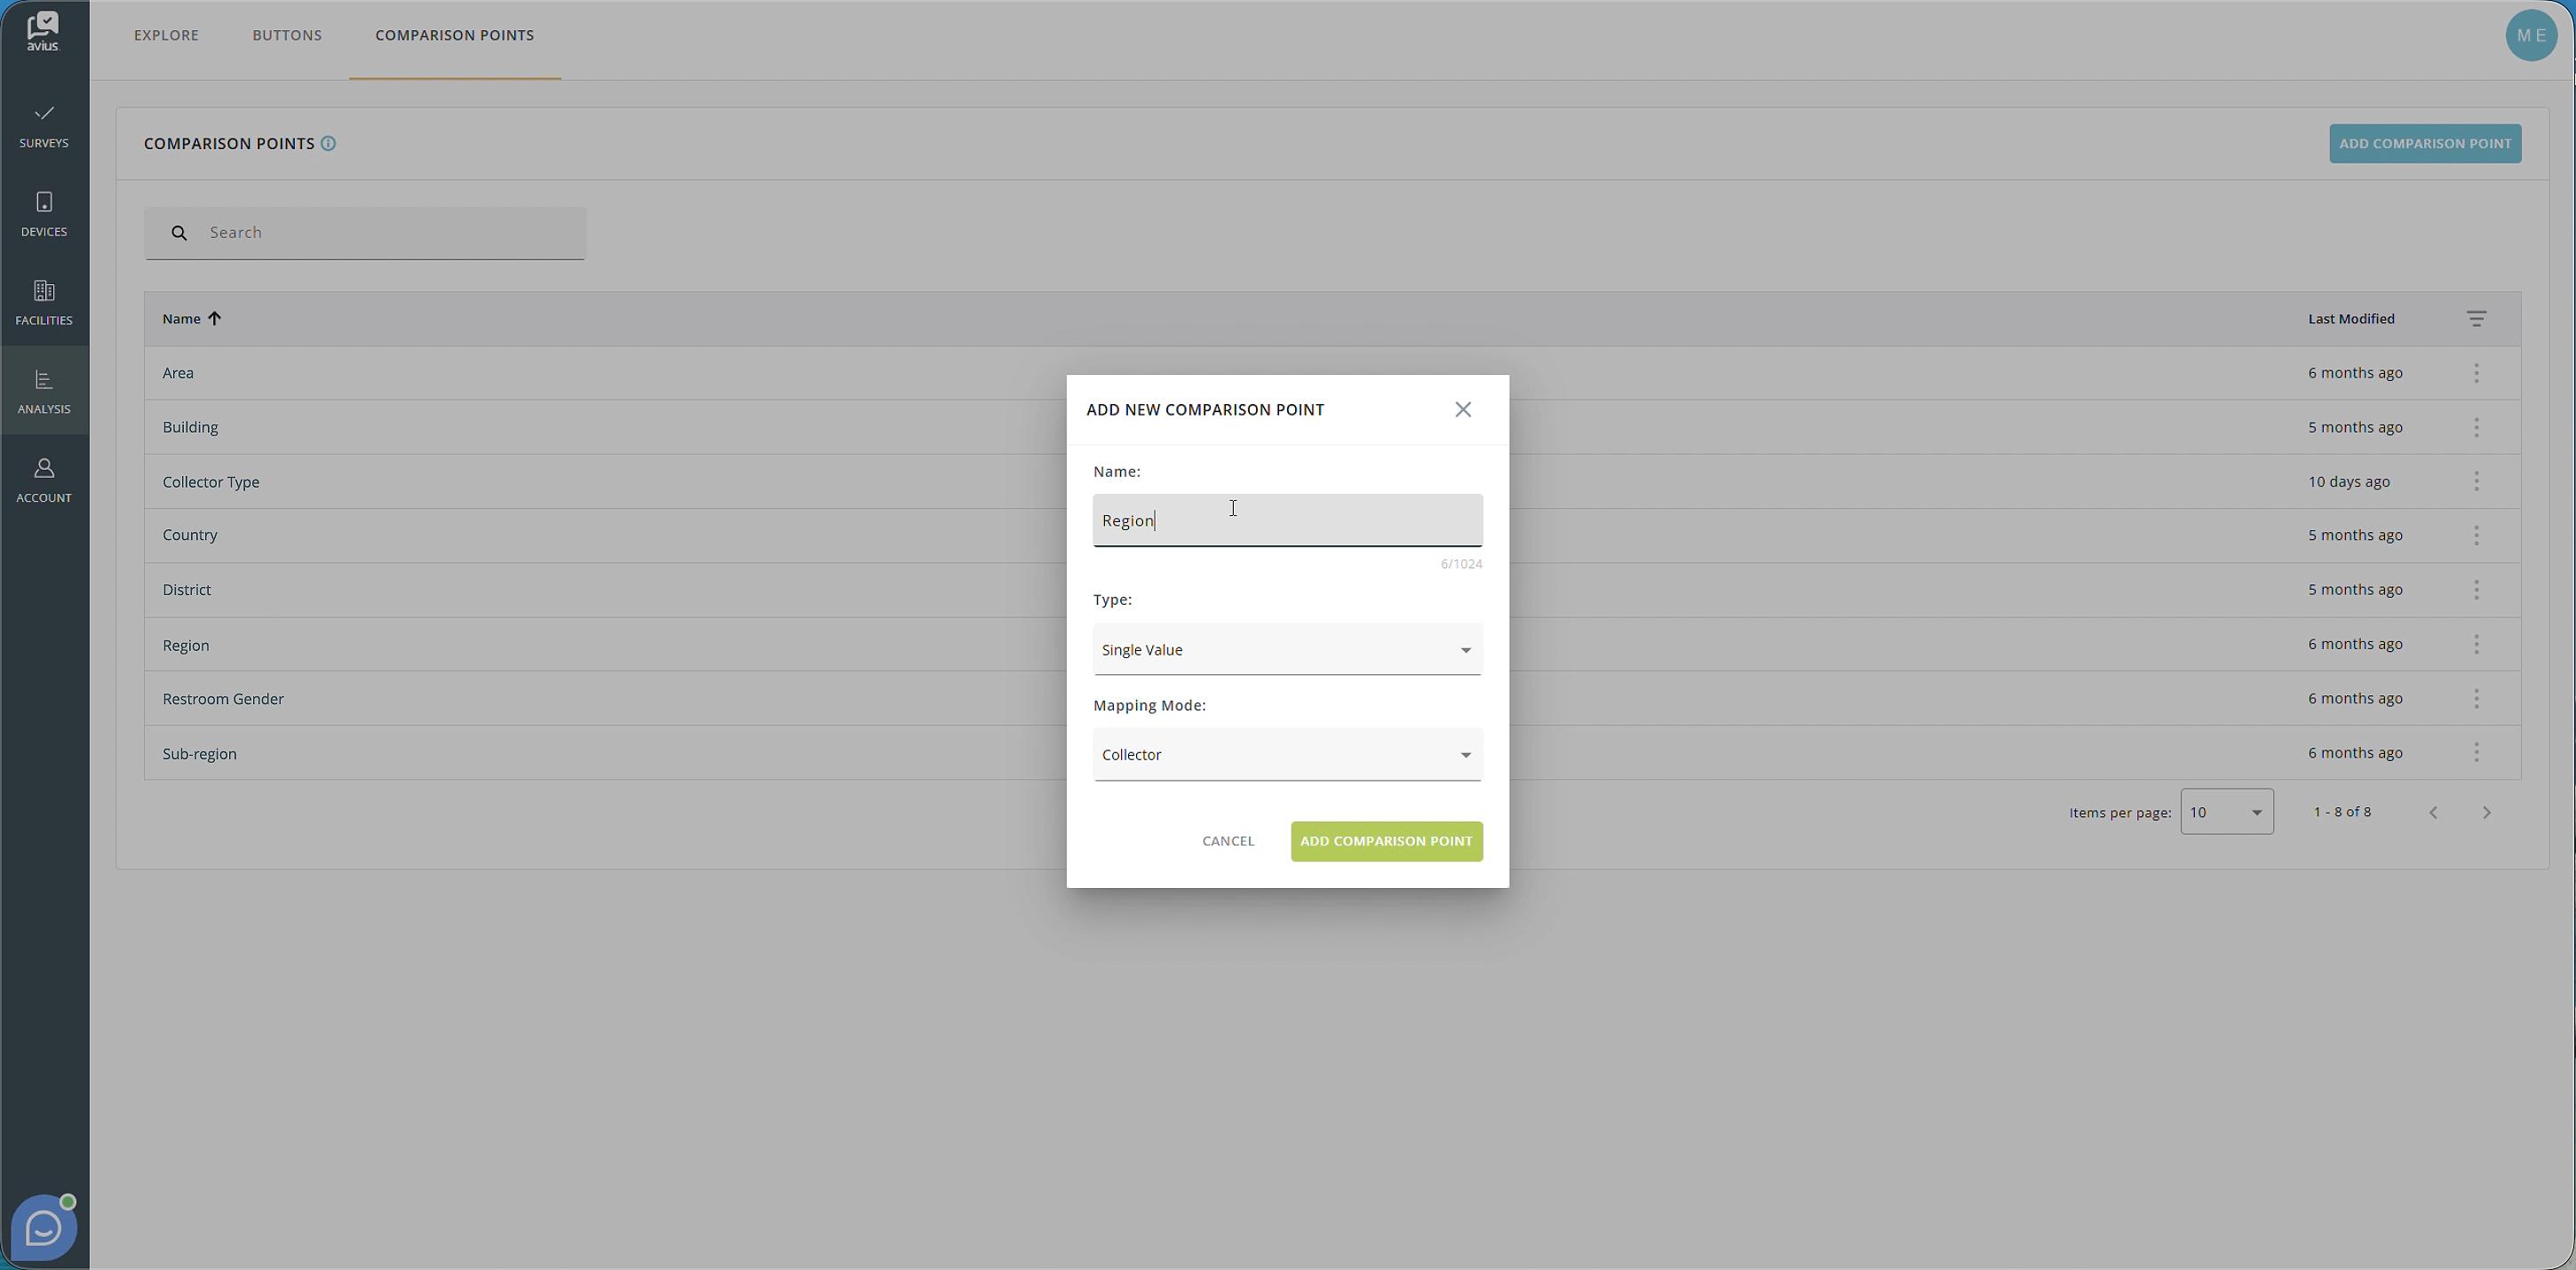
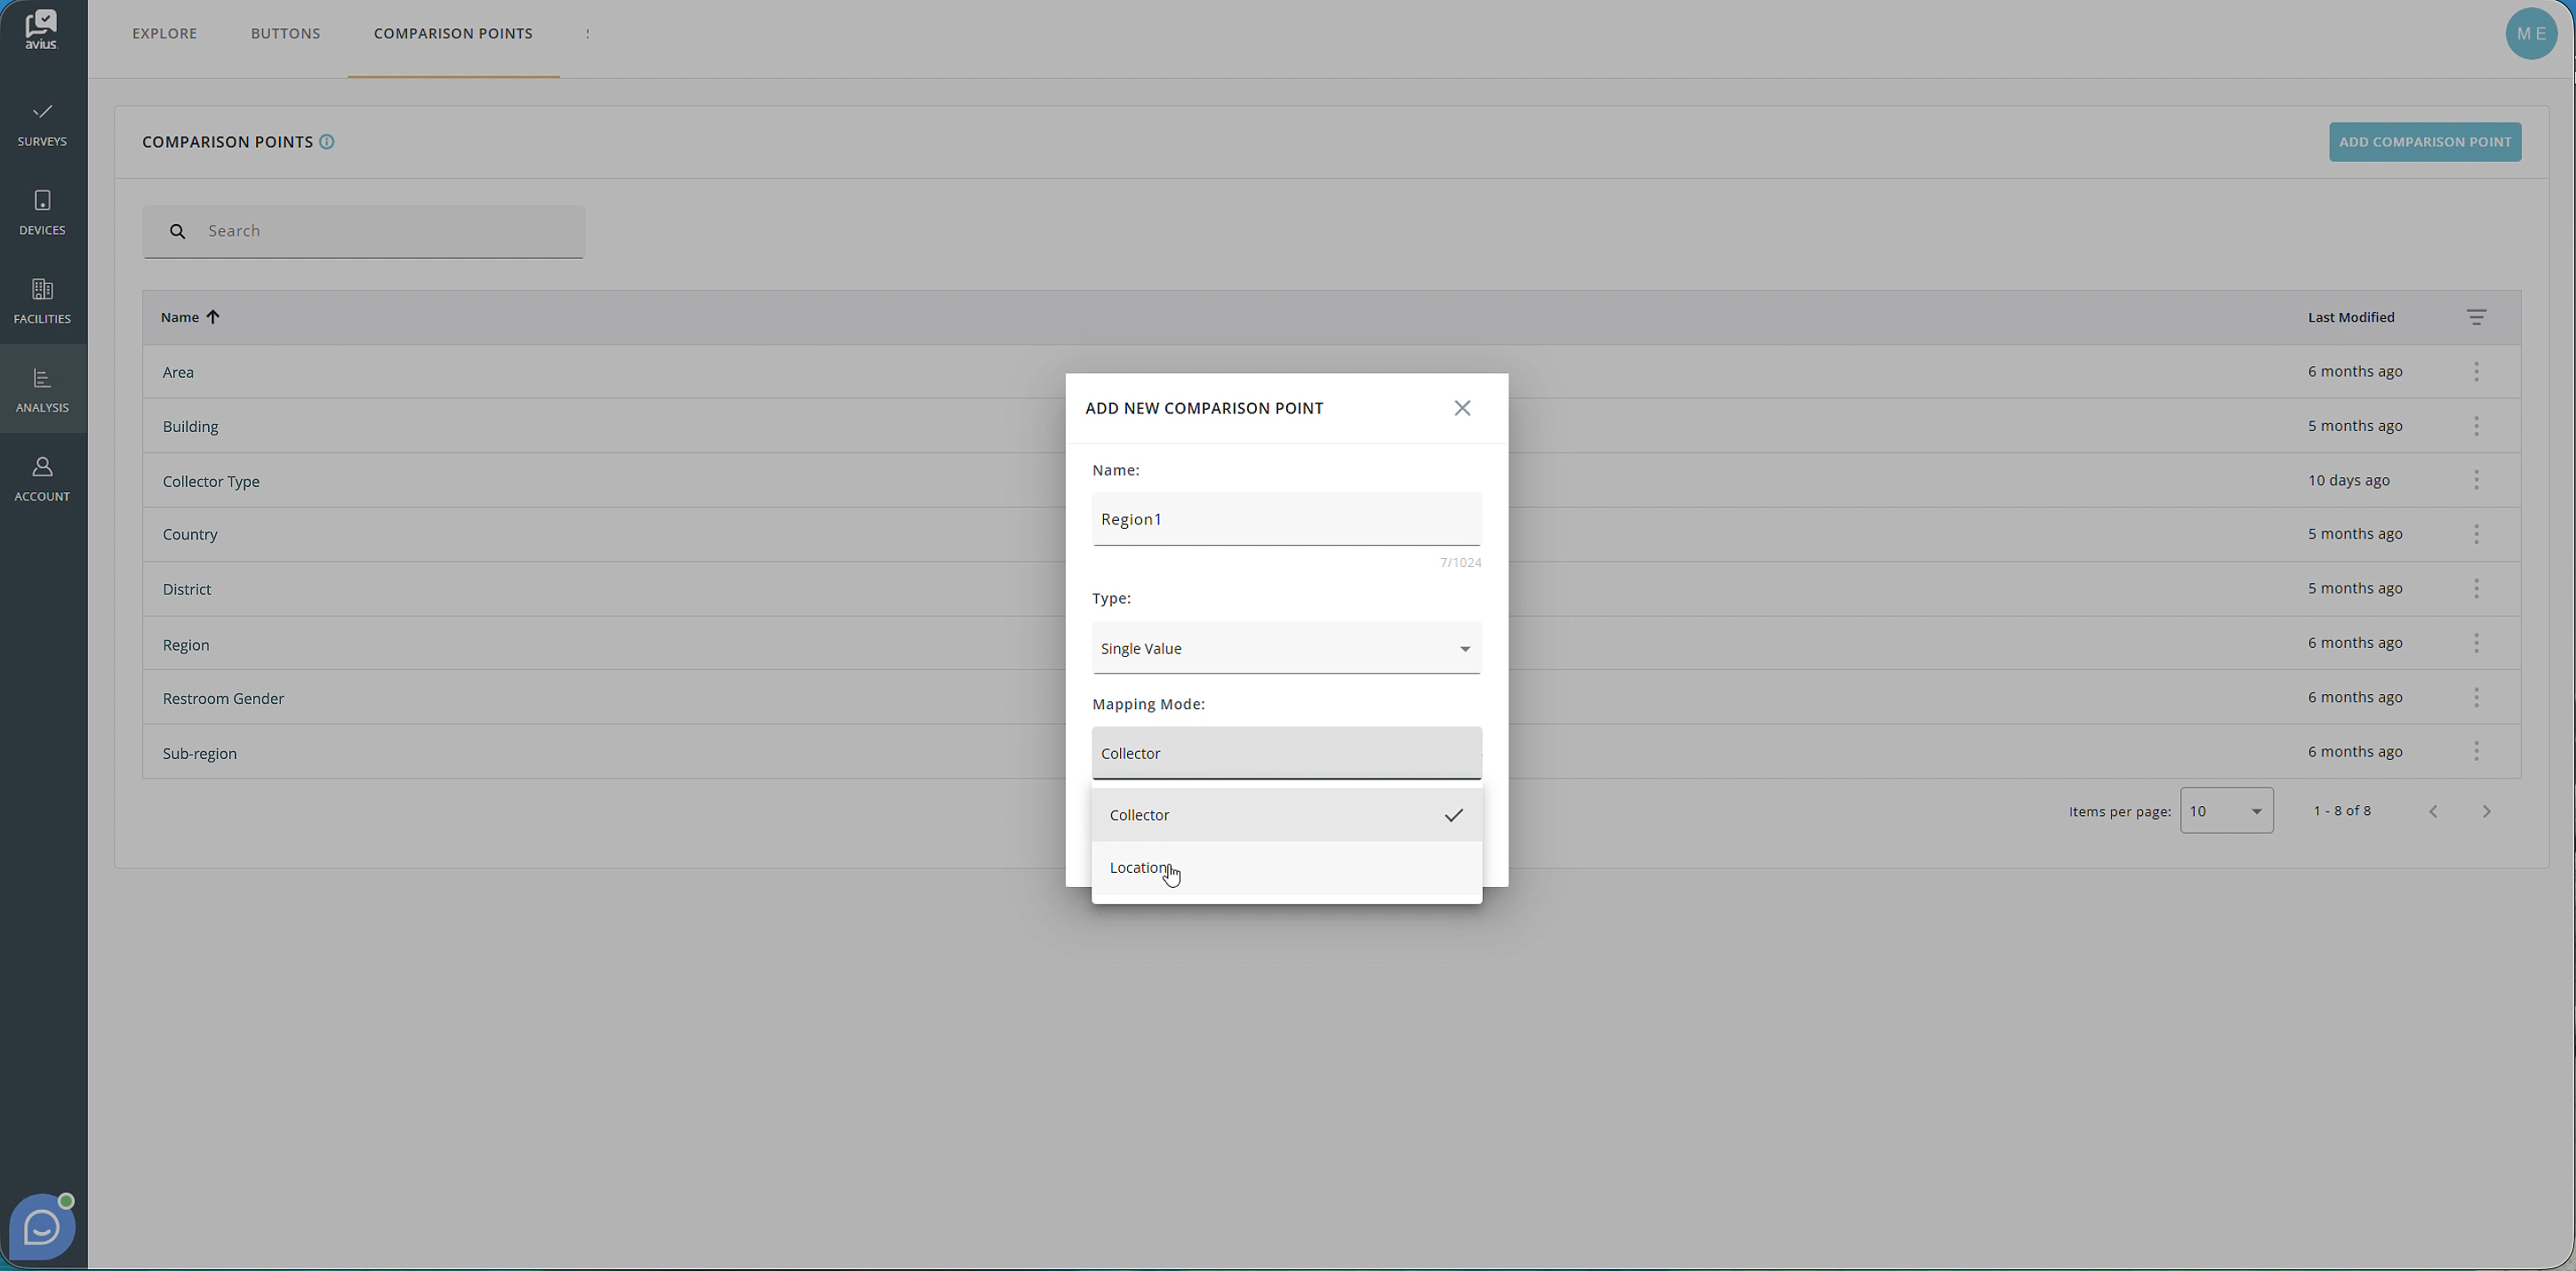
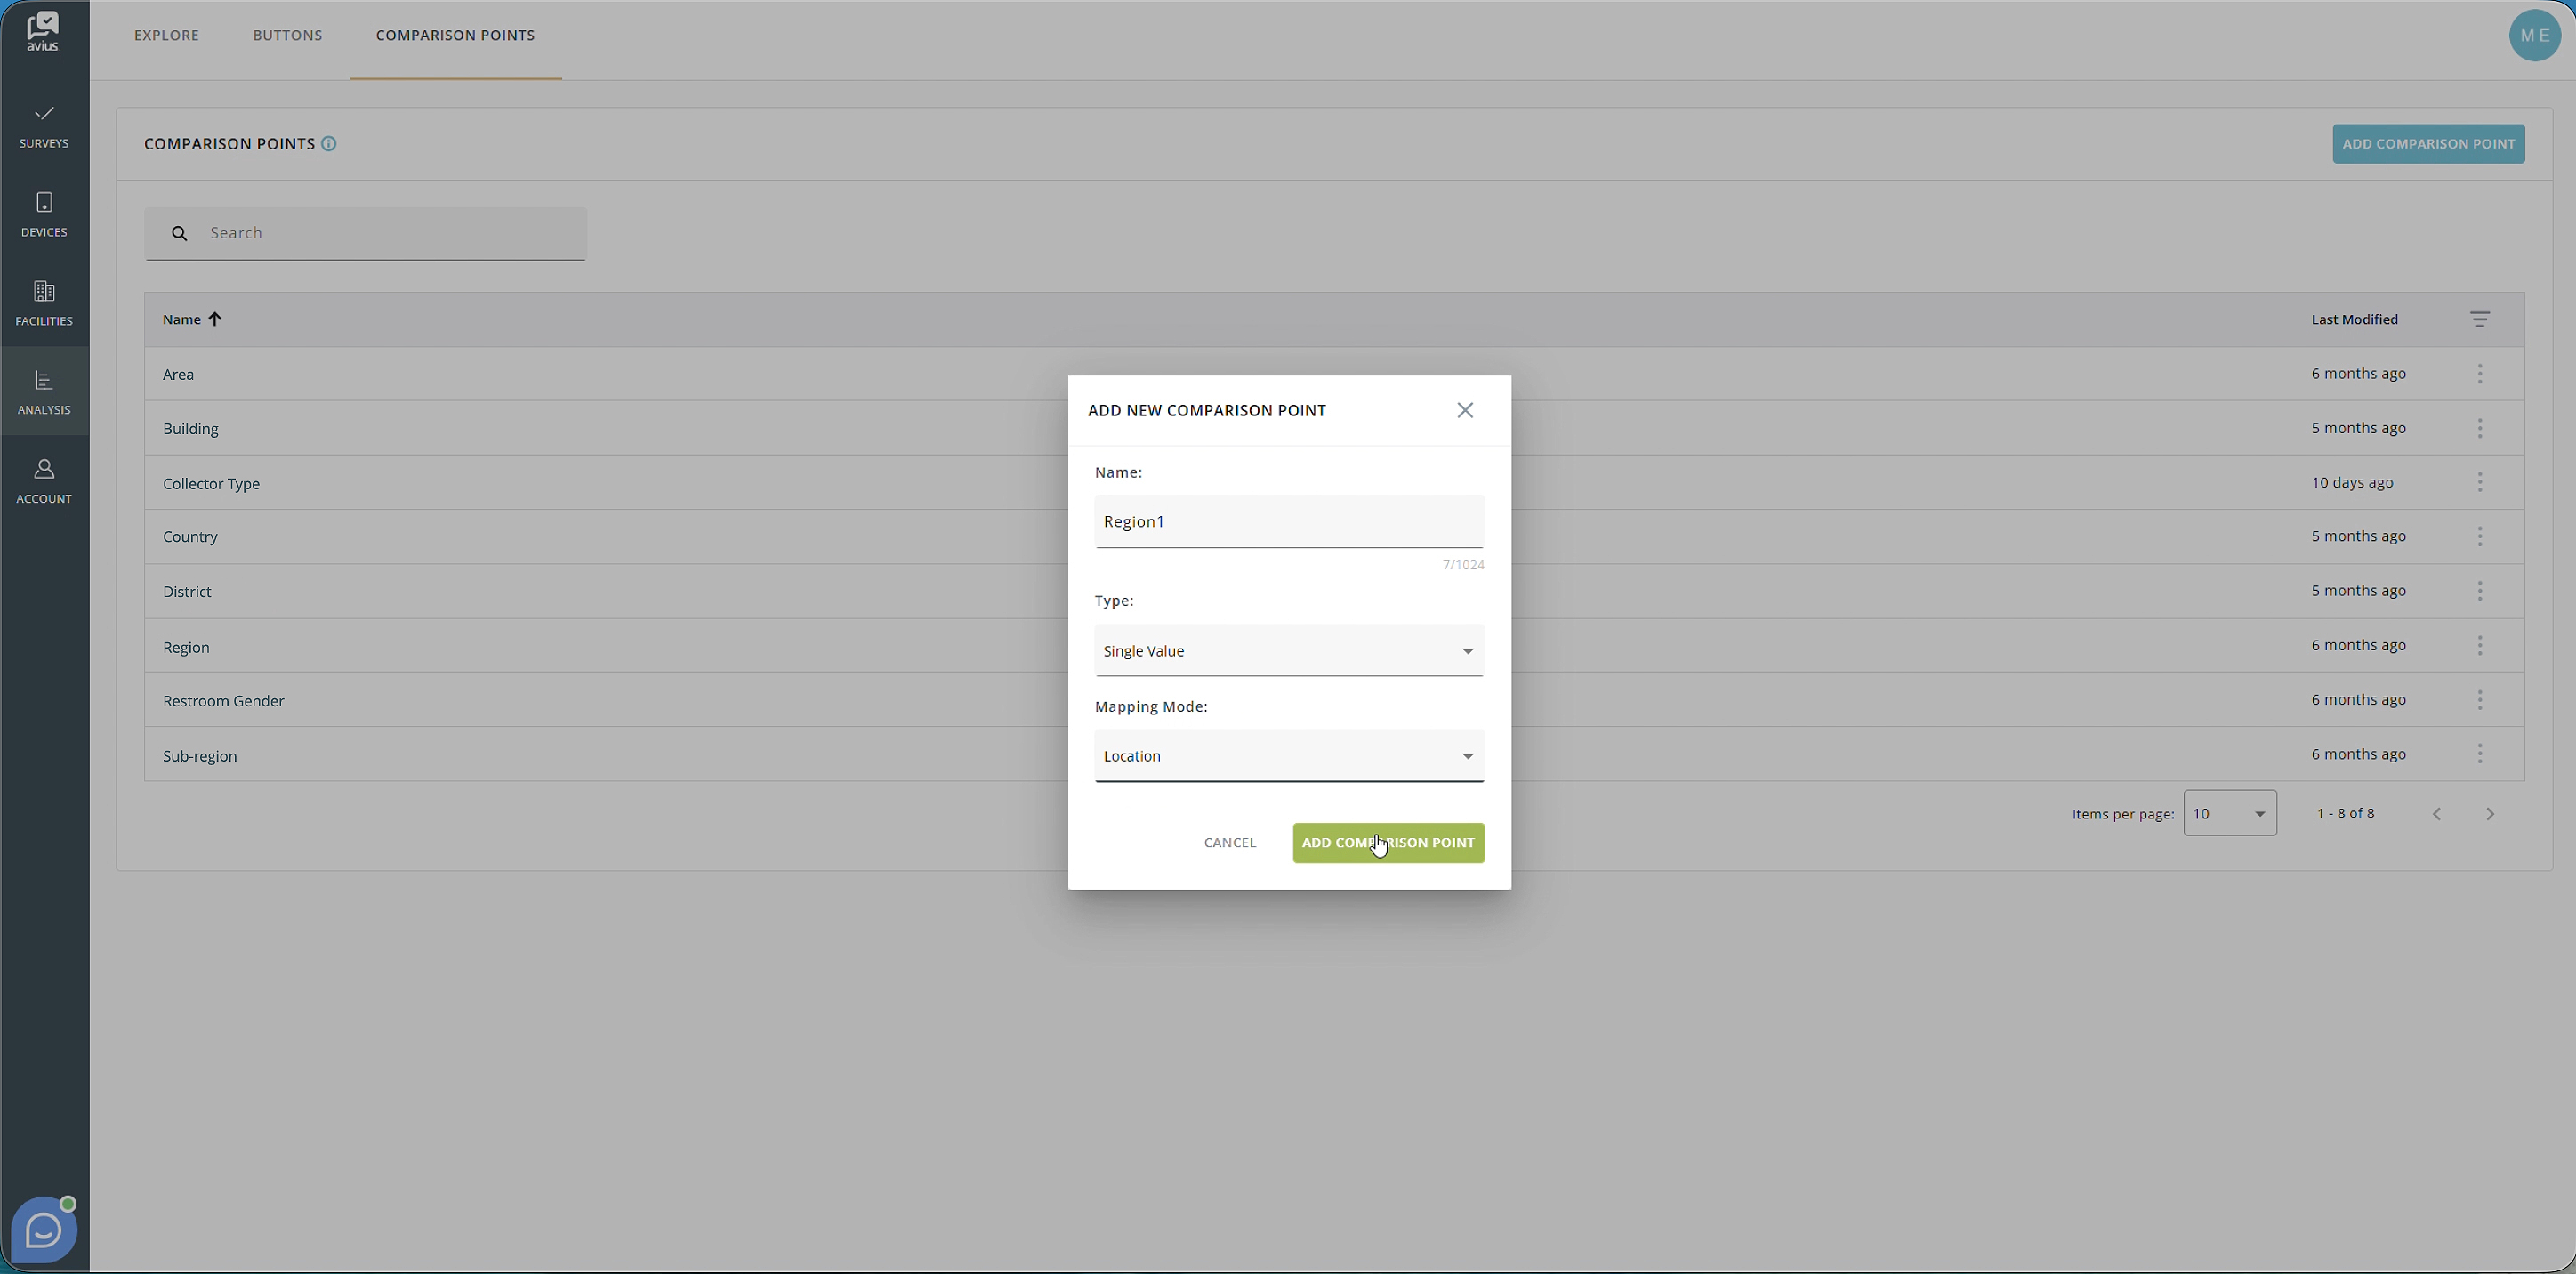
To create a new Comparison Point, click Add Comparison Point in the top-right corner of the page. A pop-up window will appear where you will need to configure the following settings
- Name - The name used to identify the Comparison Point.
-
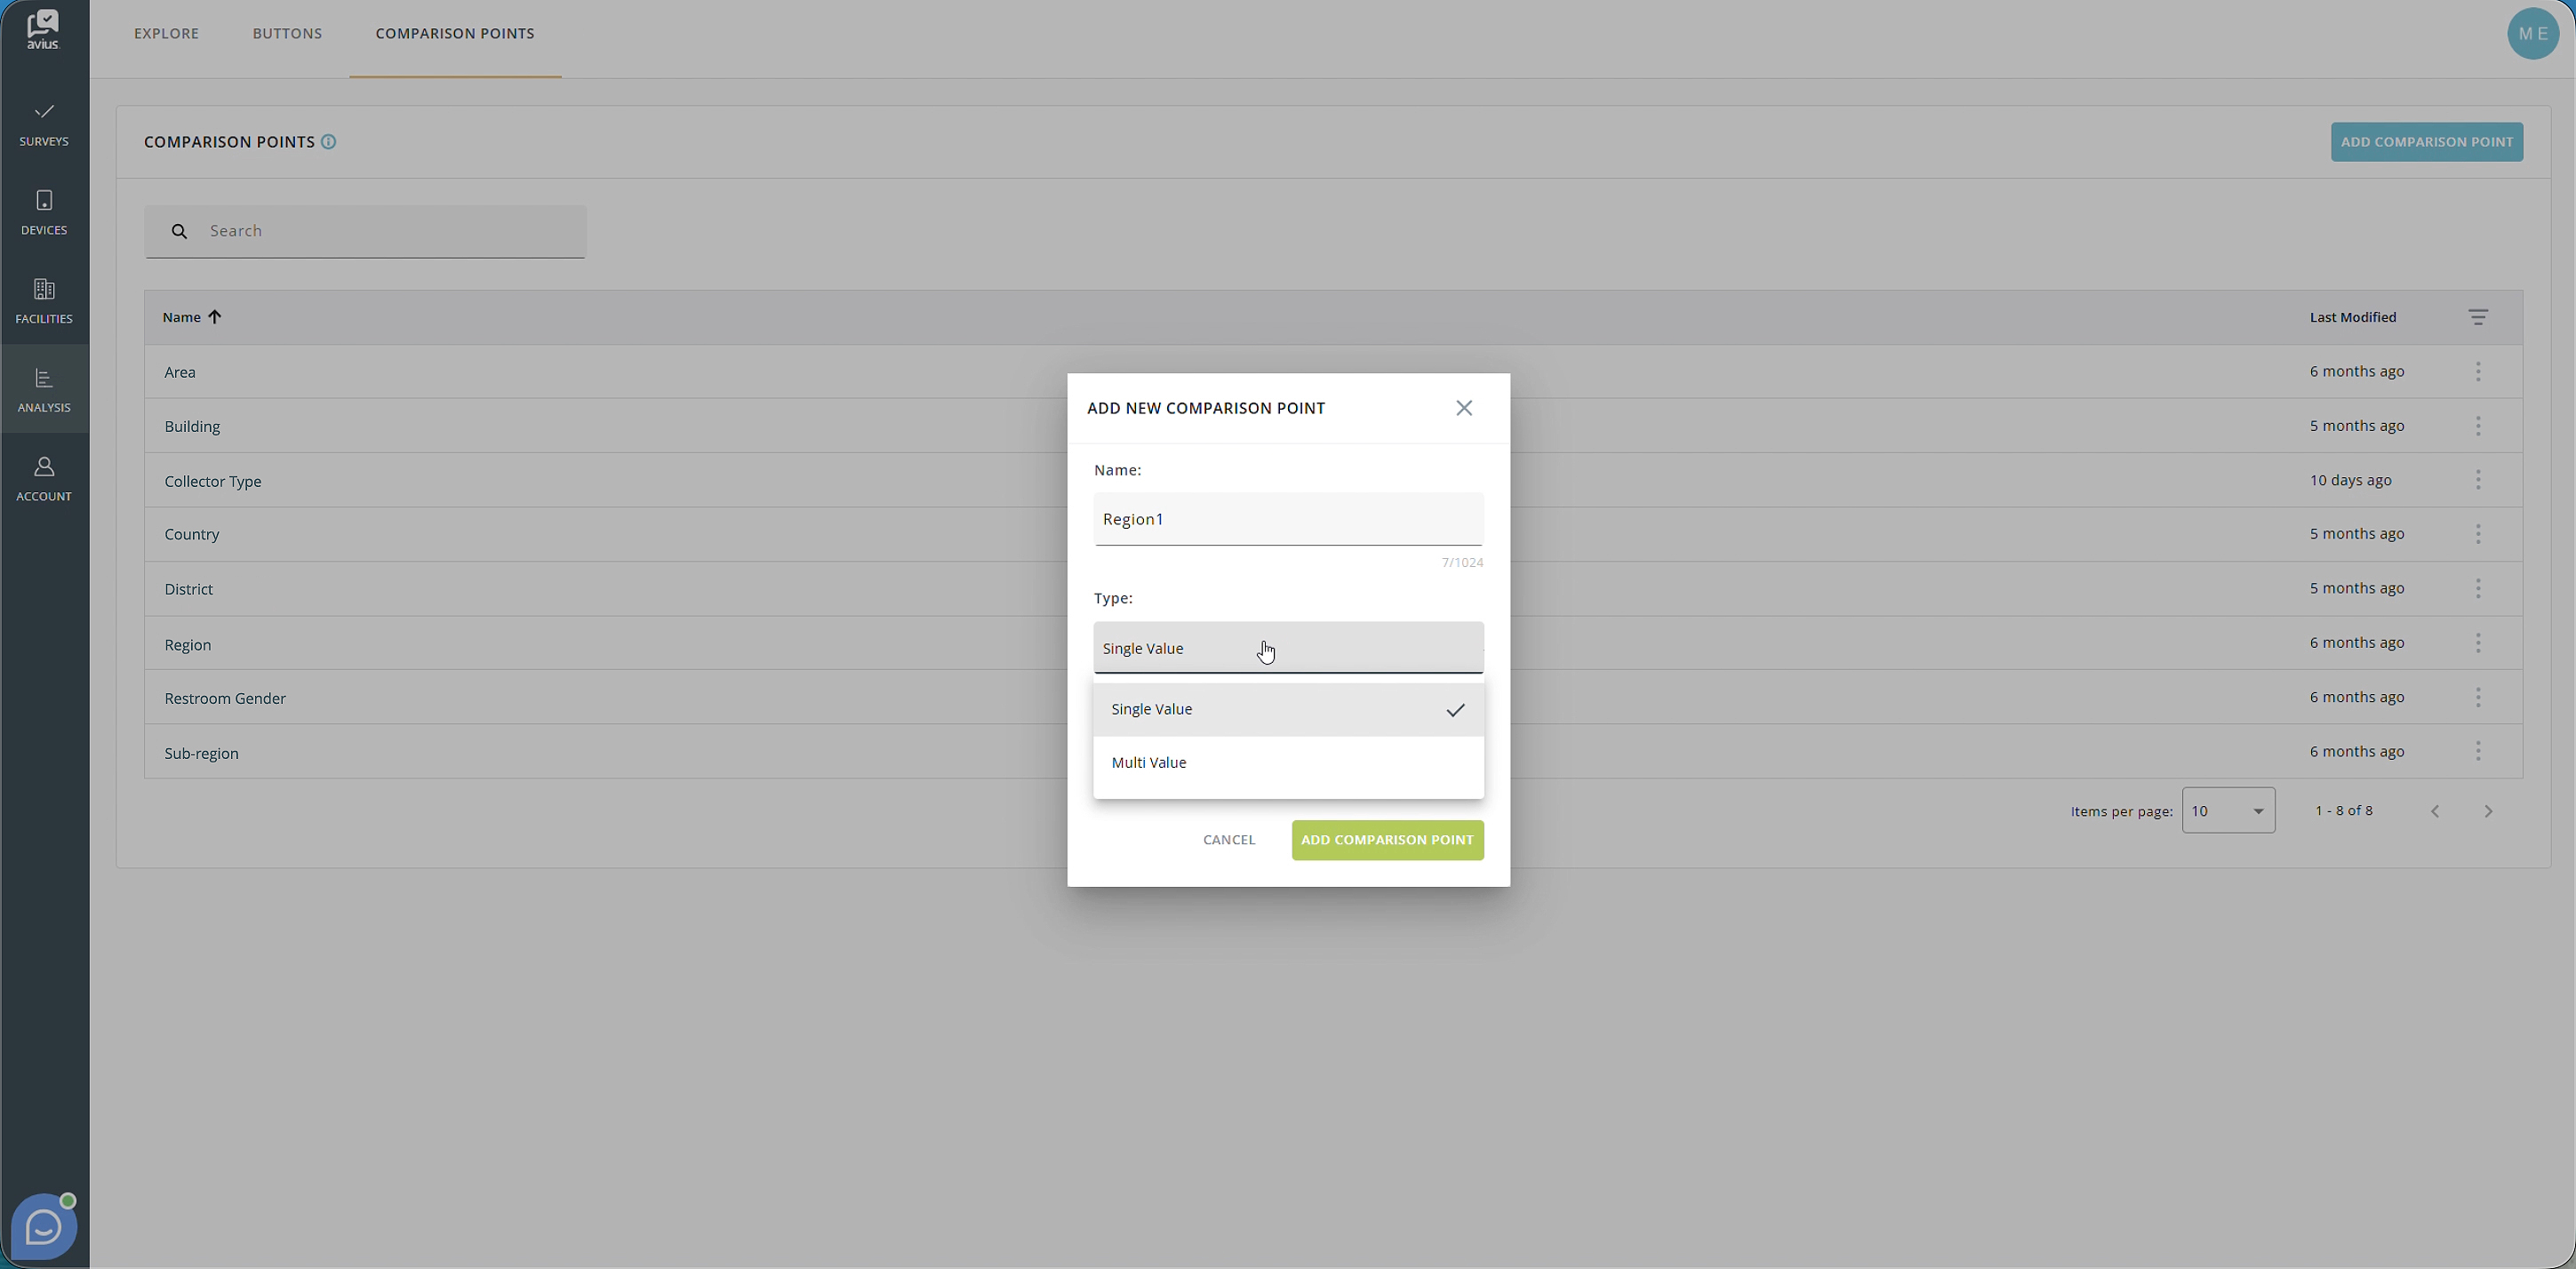
Type - Determines how values can be assigned:
- Single Value - Each location or collector can only be assigned one value.
- Multi Value - Multiple values can be assigned to the same location or collector.
- Mapping Mode - Determines whether the Comparison Point is applied to Locations or Collectors
Click for more detail
Click for more detail
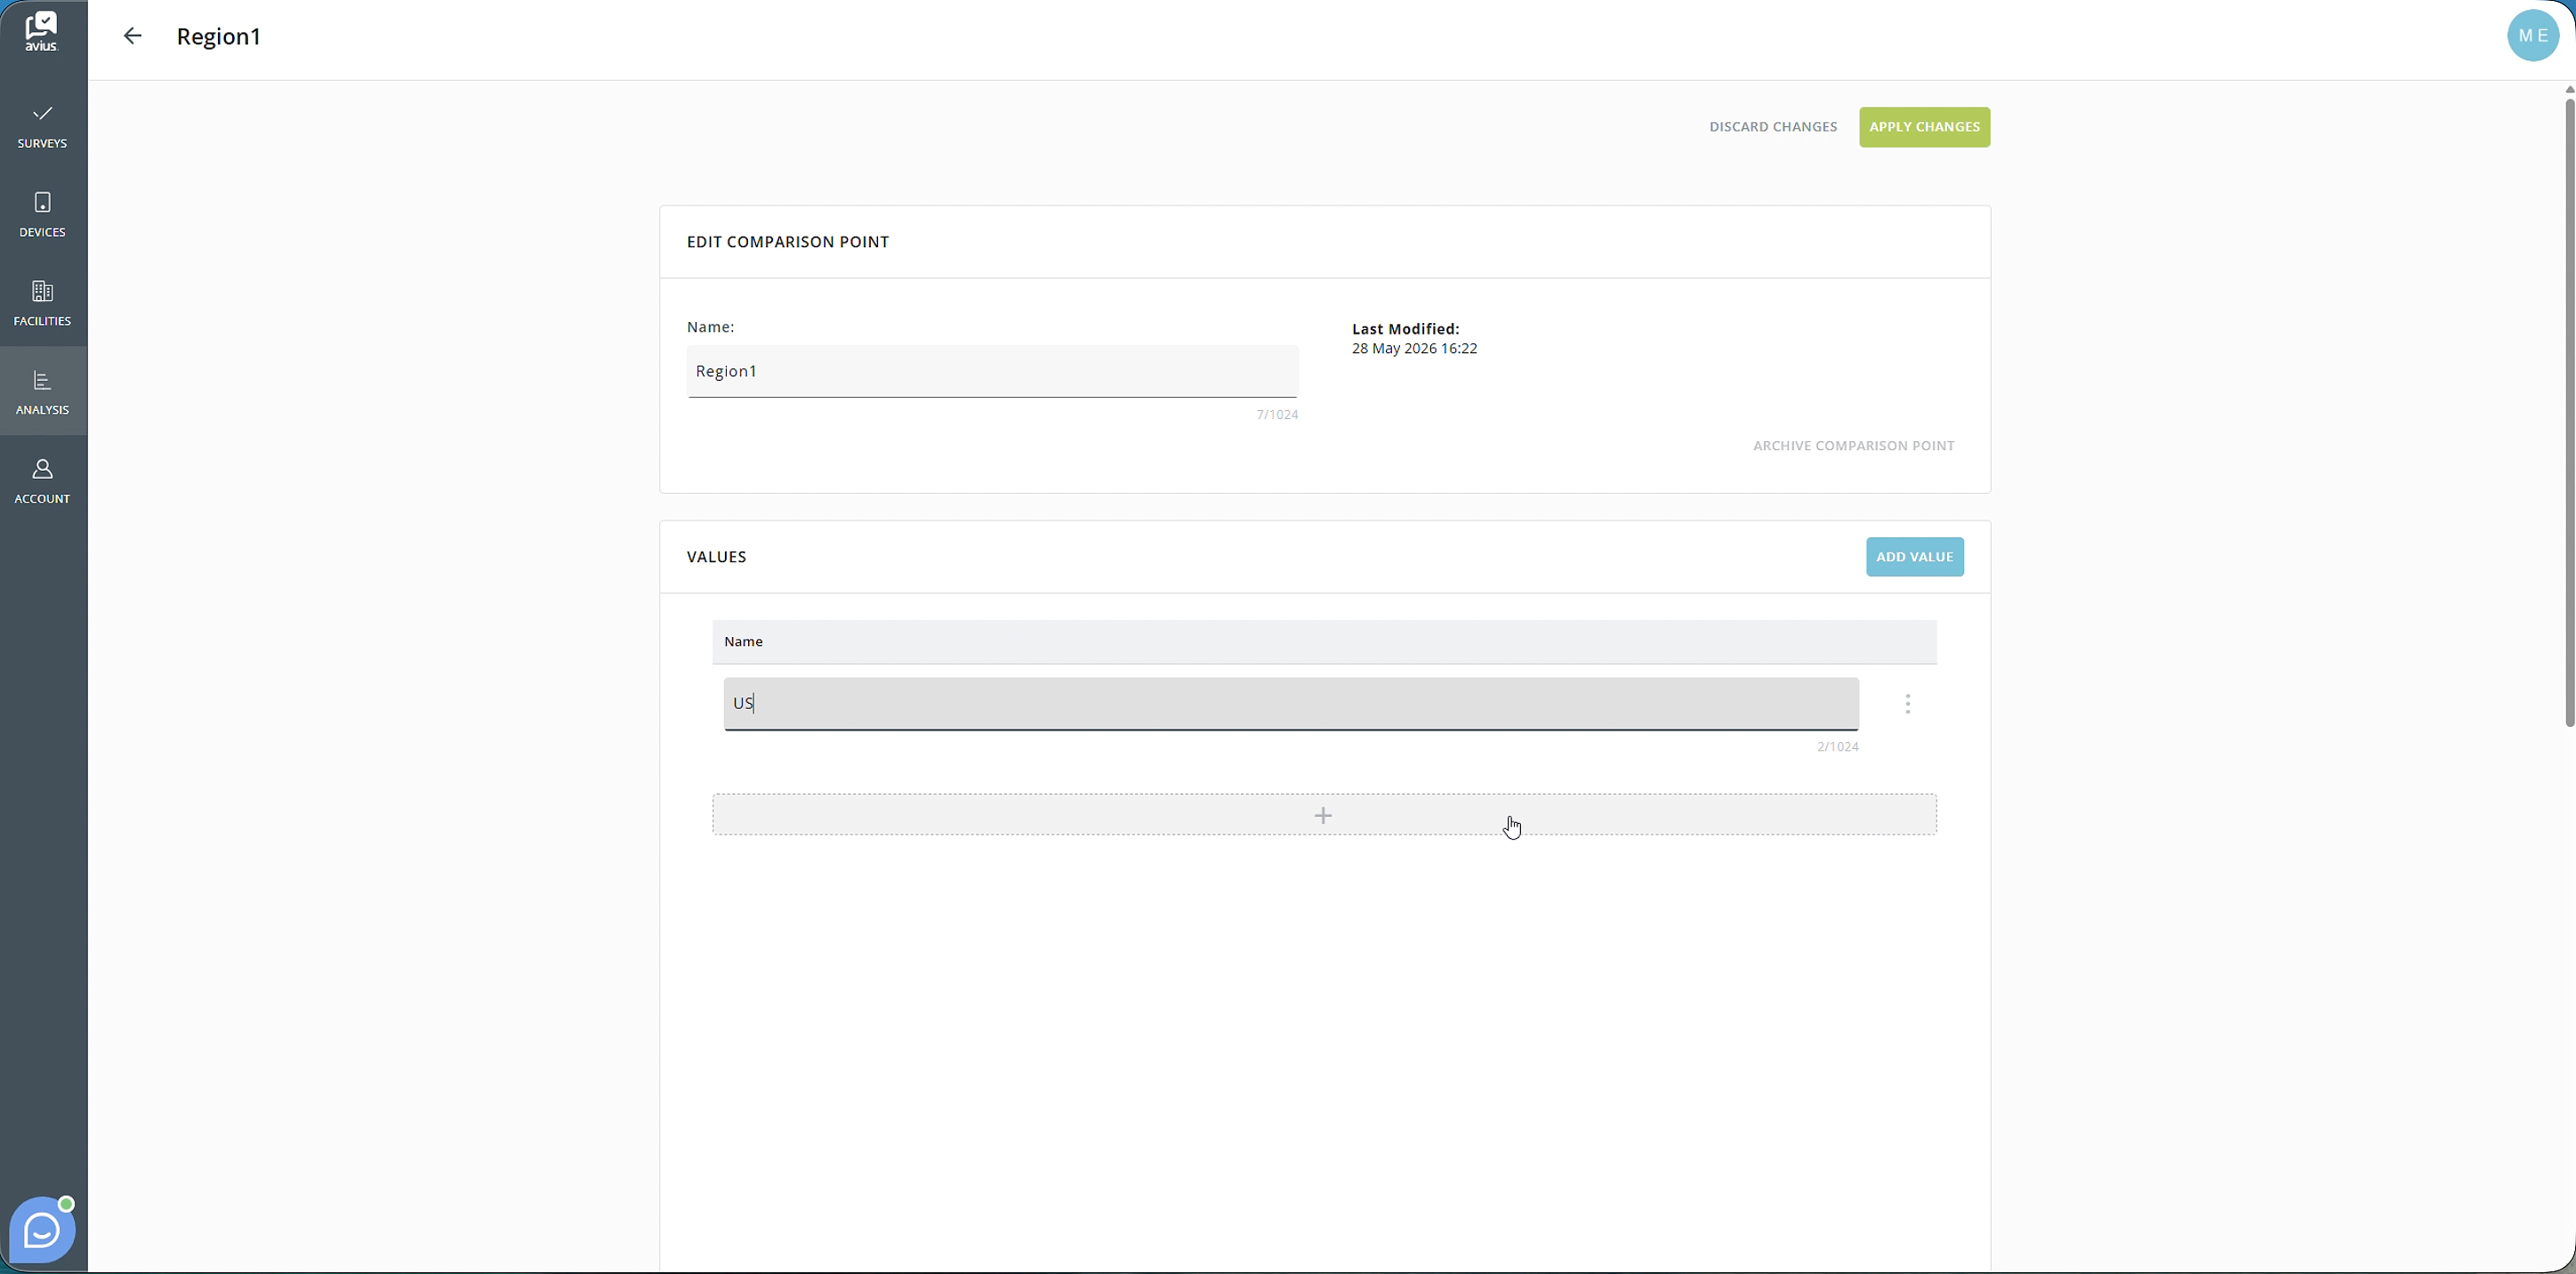
EDITING THE COMPARISON POINT
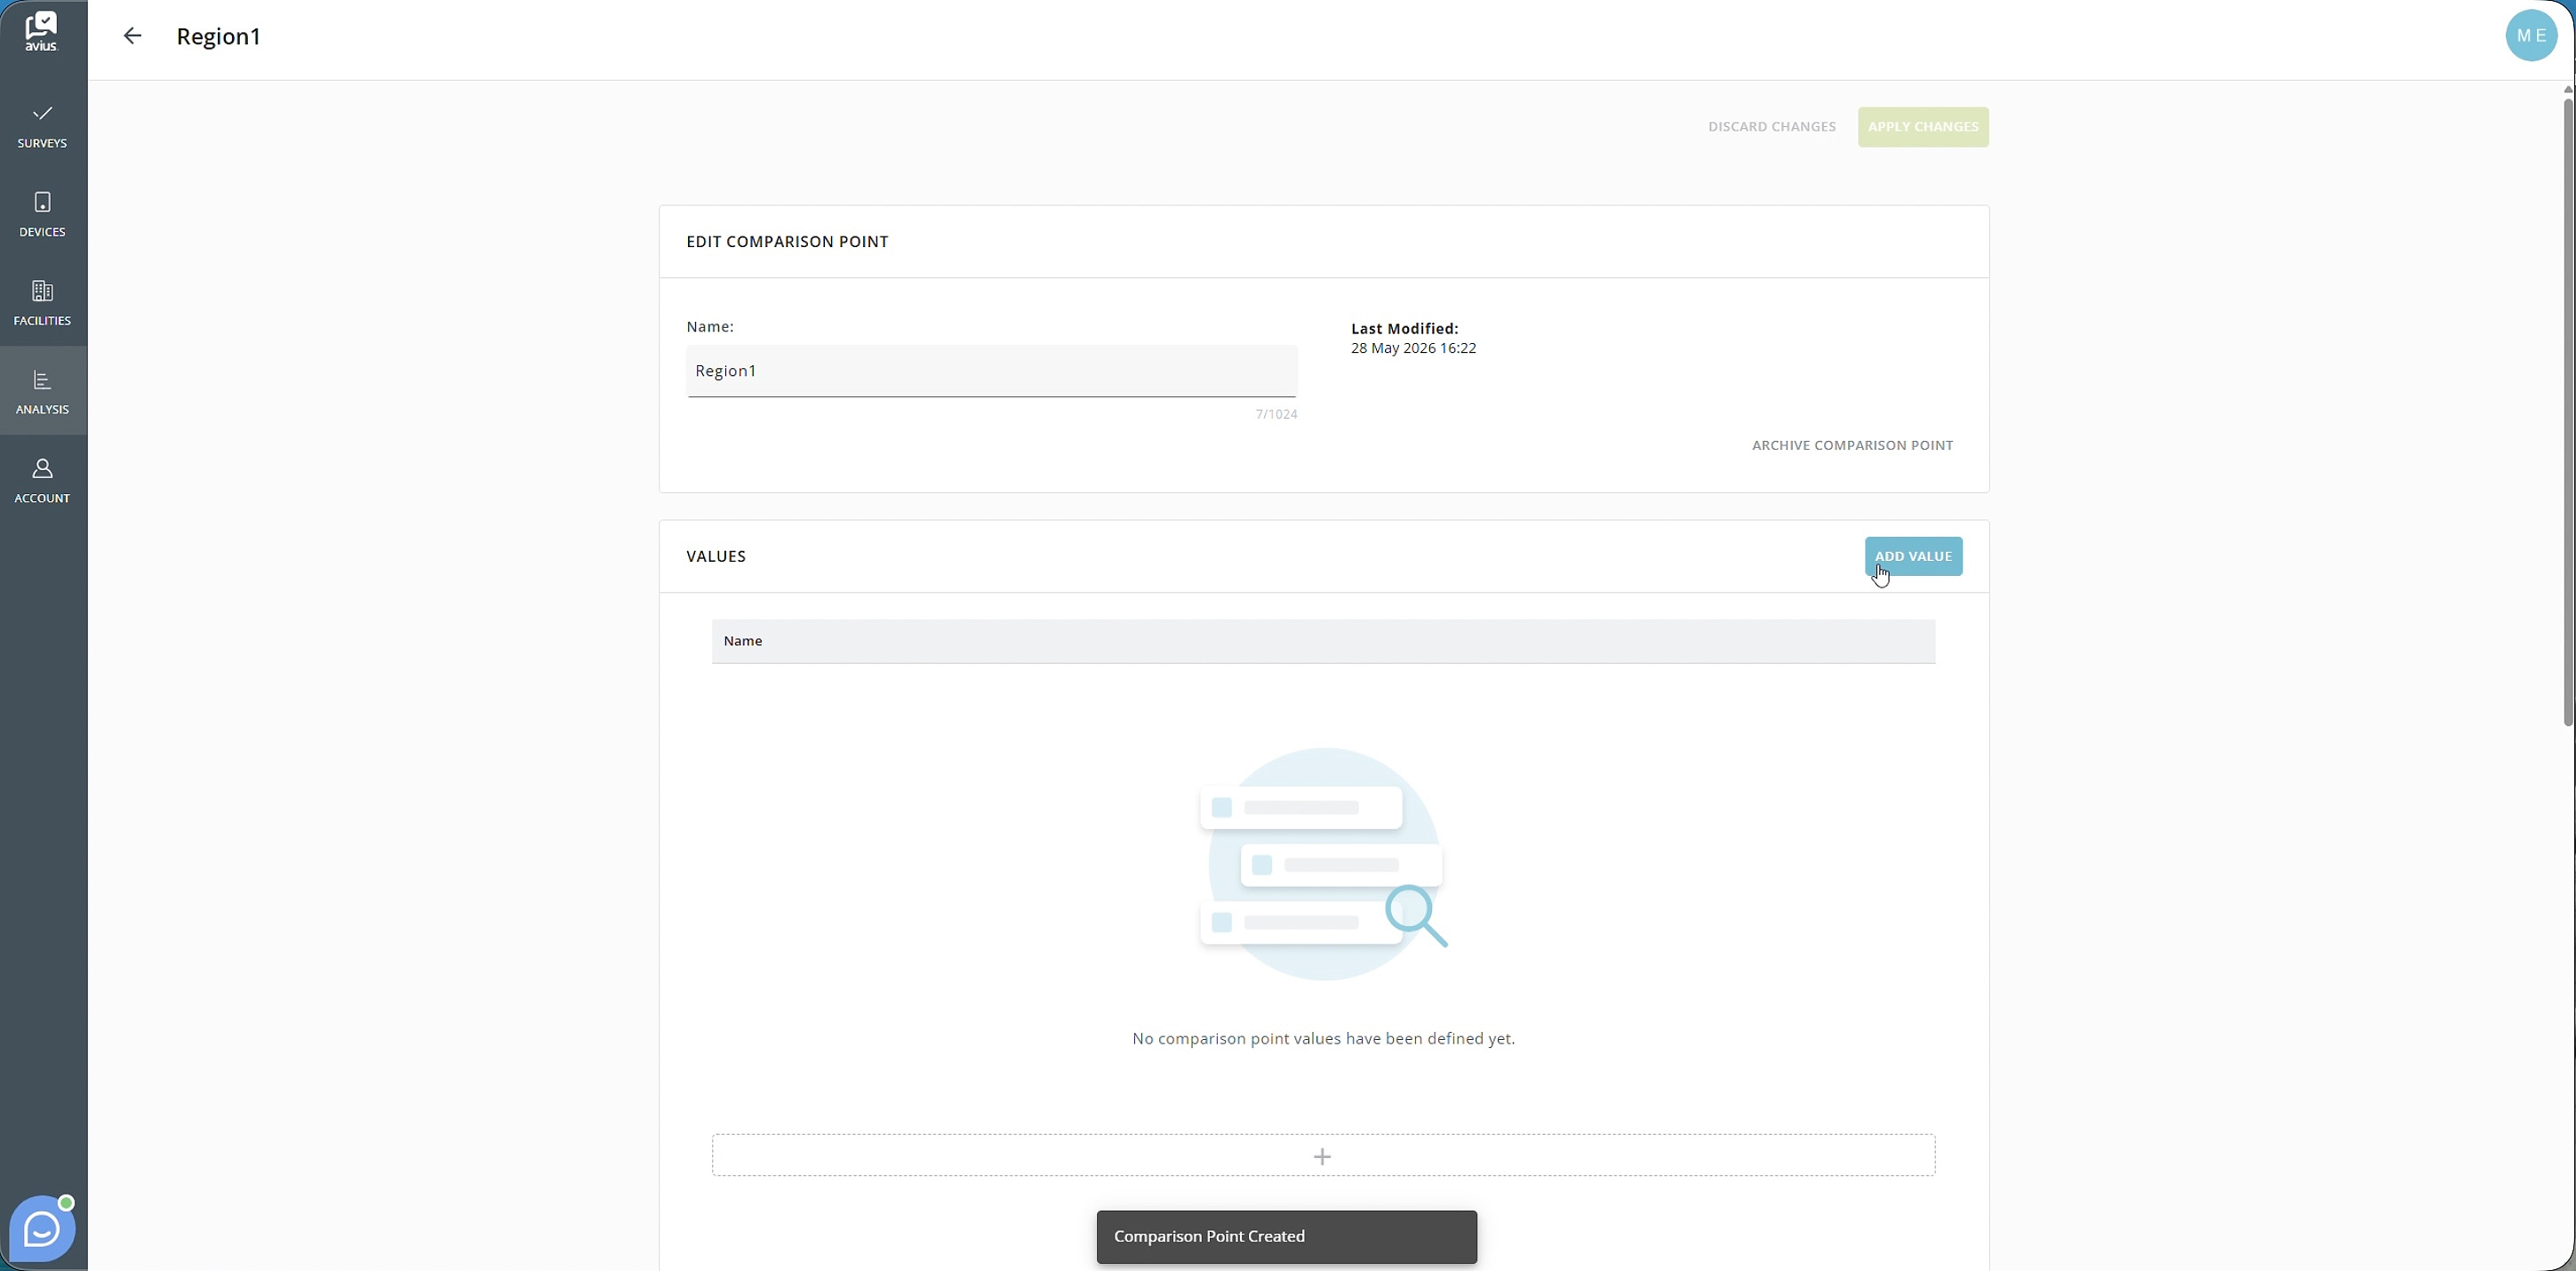
At the top of the page, you can update the name of the Comparison Point. This name will be displayed when using Comparison Point filters and breakdowns within the Explore section of Analysis.
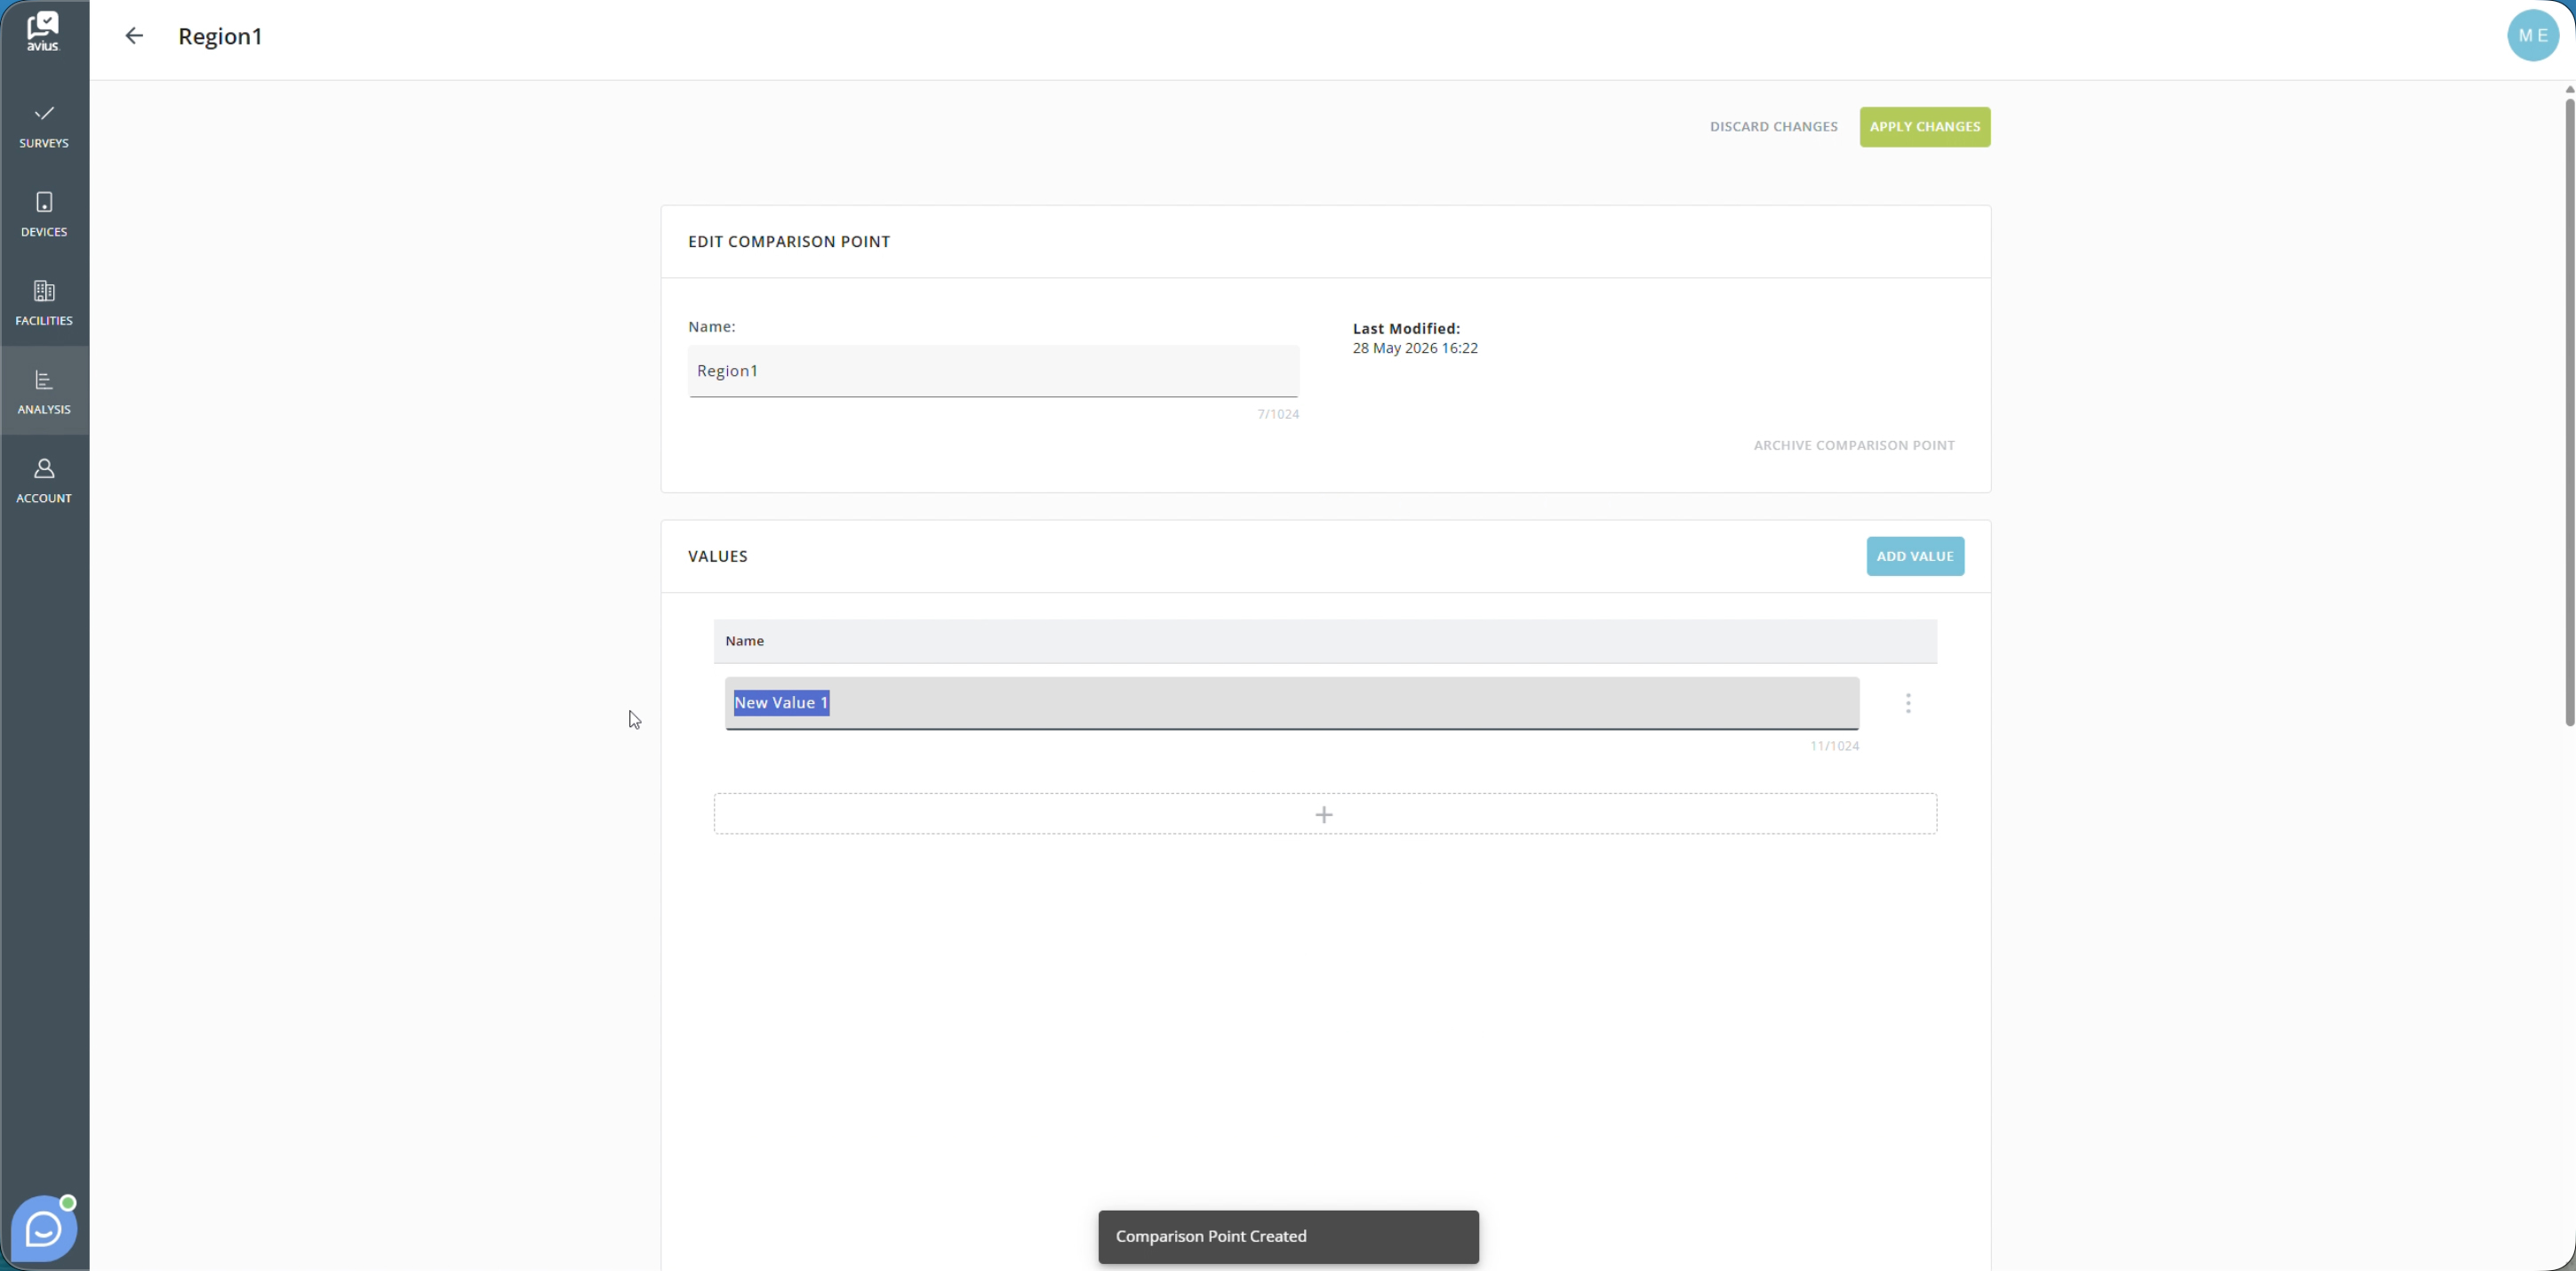
The Values section is used to define the categories that locations or collectors can be assigned to.
To add a new value:
- Click Add Value in the top-right corner of the Values section, or
- Click the + button beneath the last value in the list.
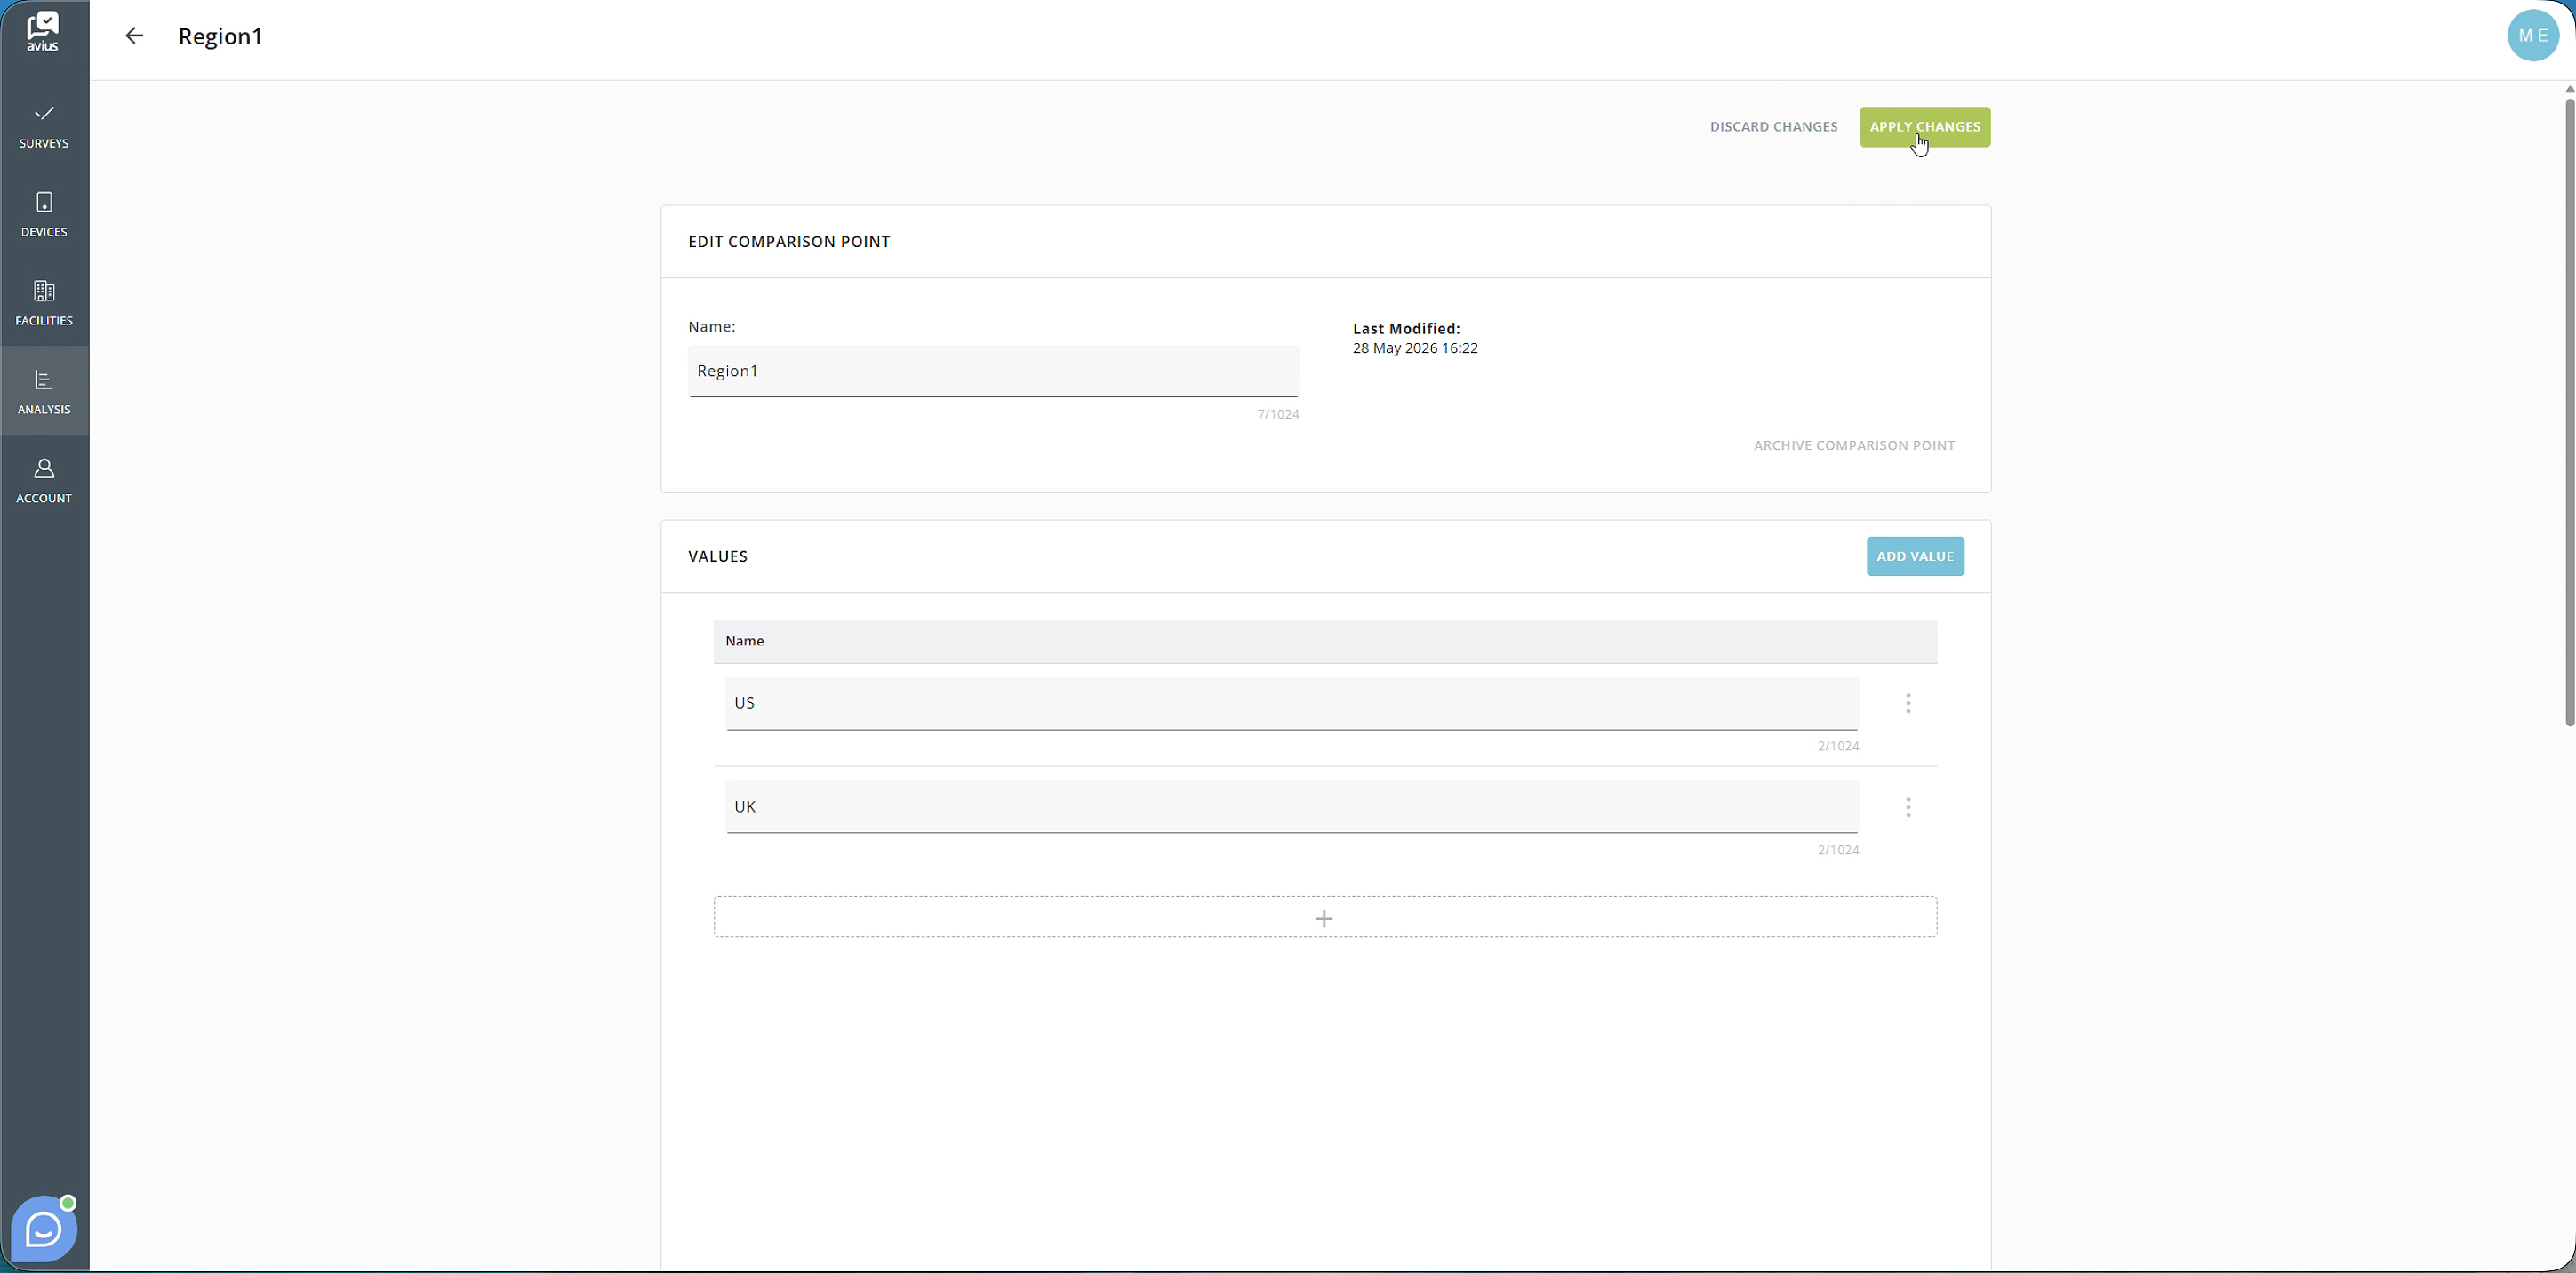
To delete a value:
- Click the three-dot menu next to the value and select Delete
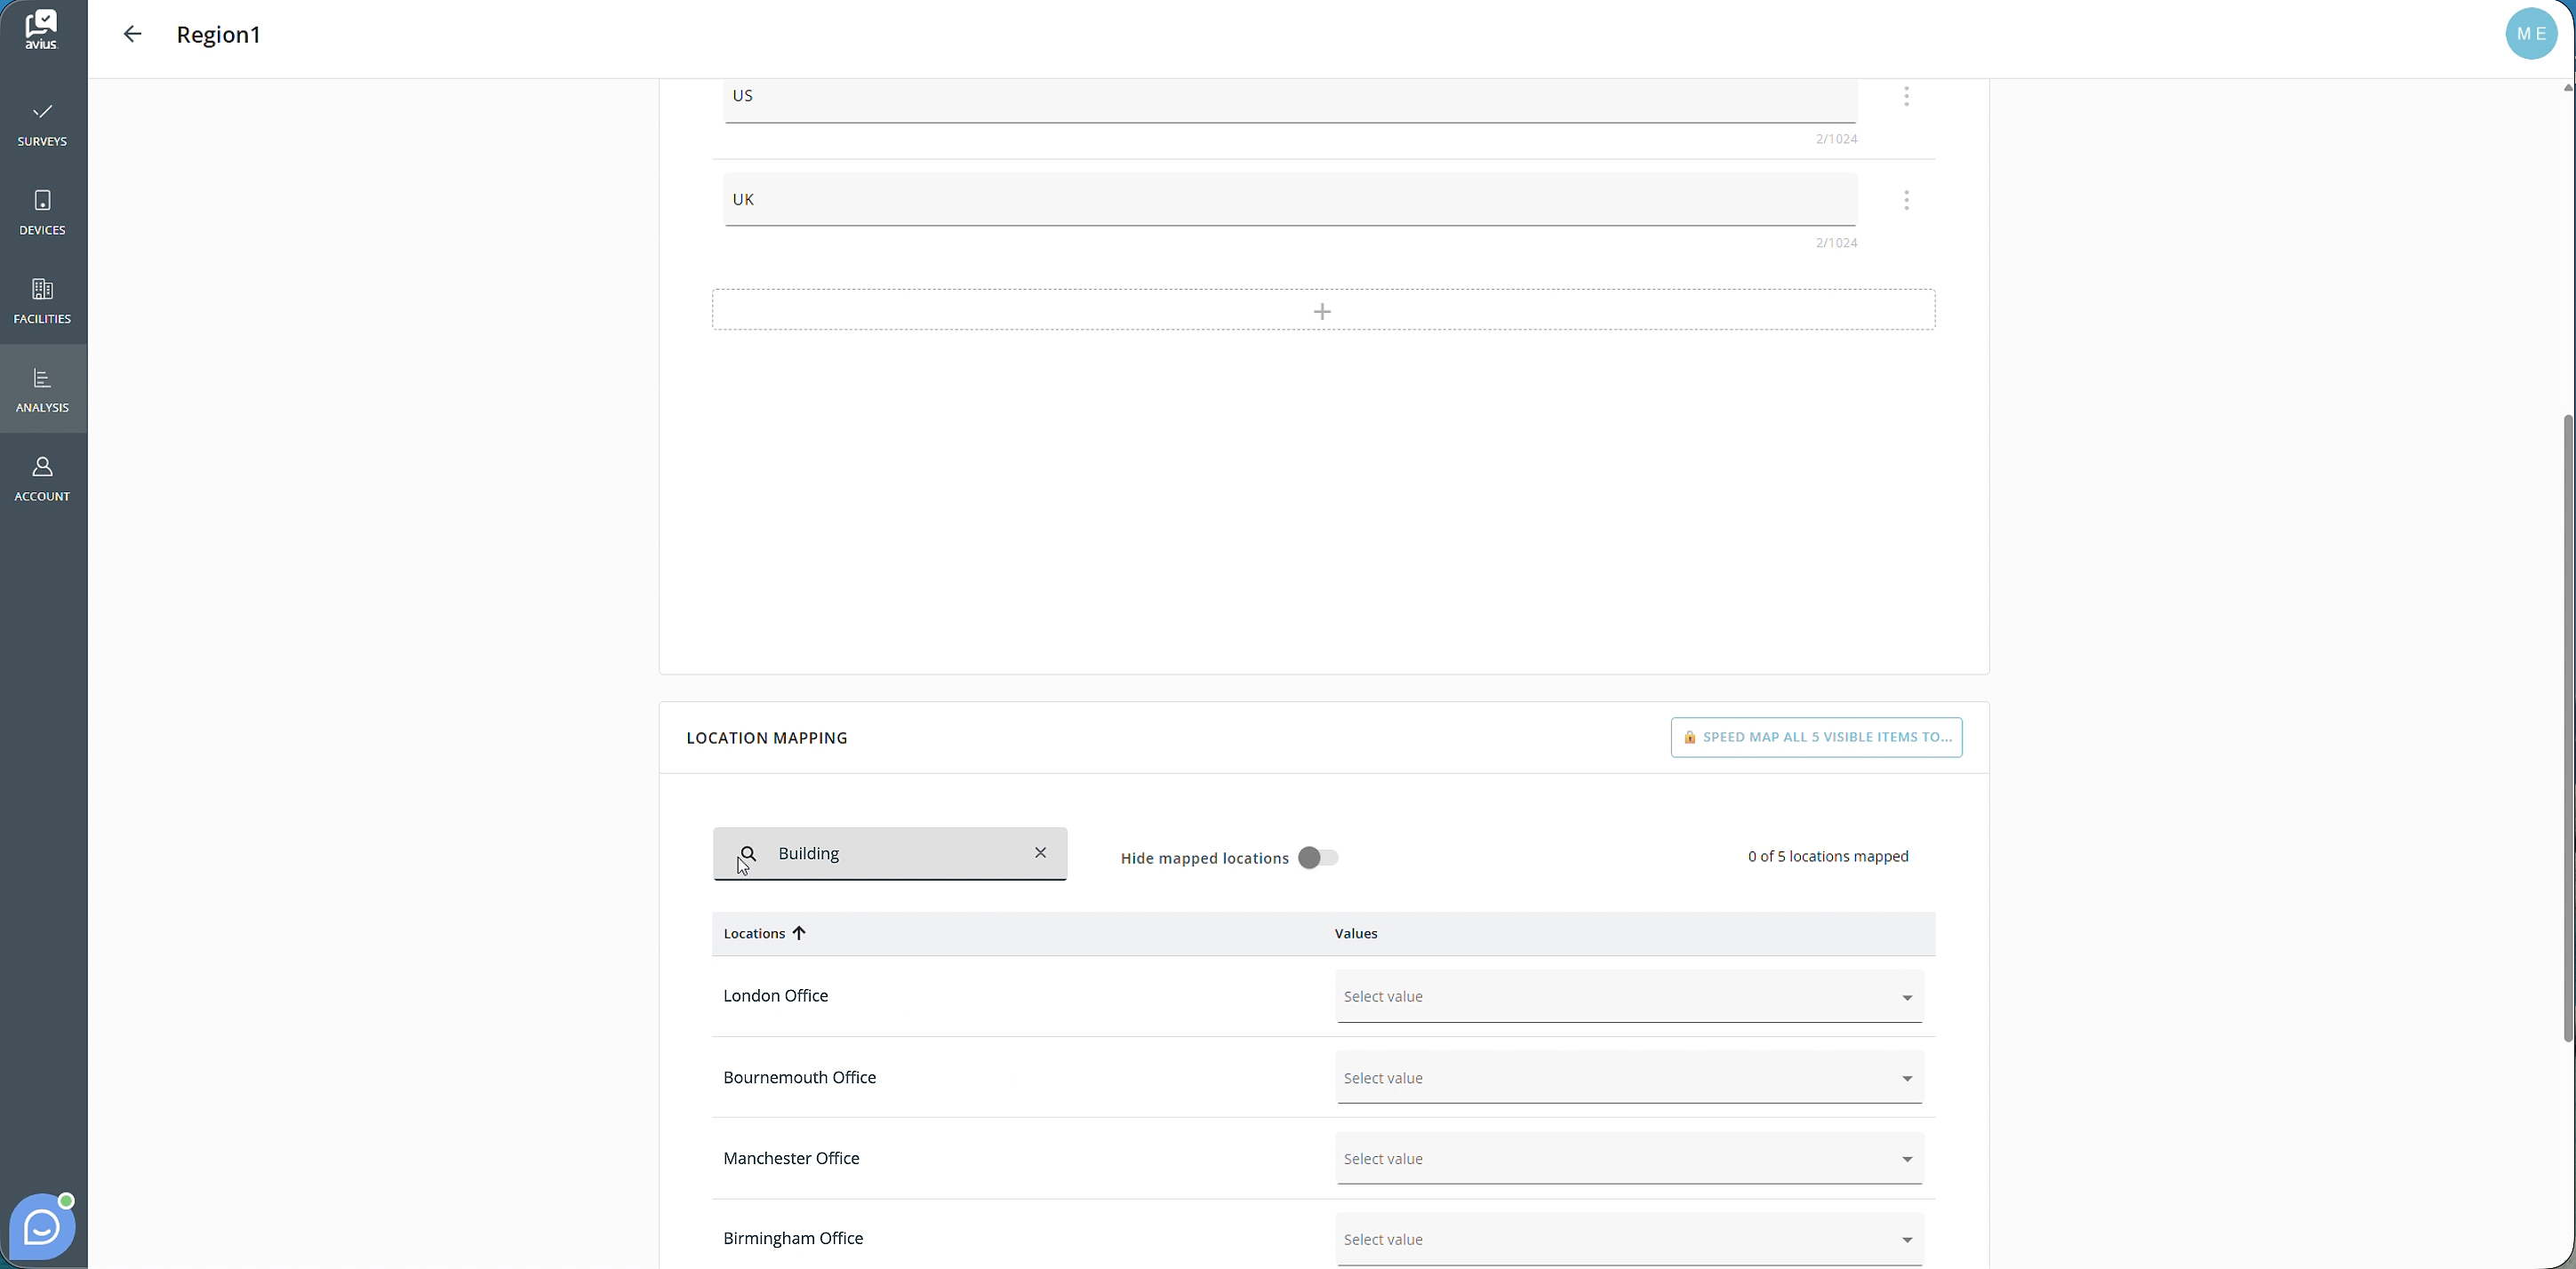
MAPPING LOCATIONS OR COLLECTORS
The Location/Collector Mapping section displays all locations or collectors within your organisation.
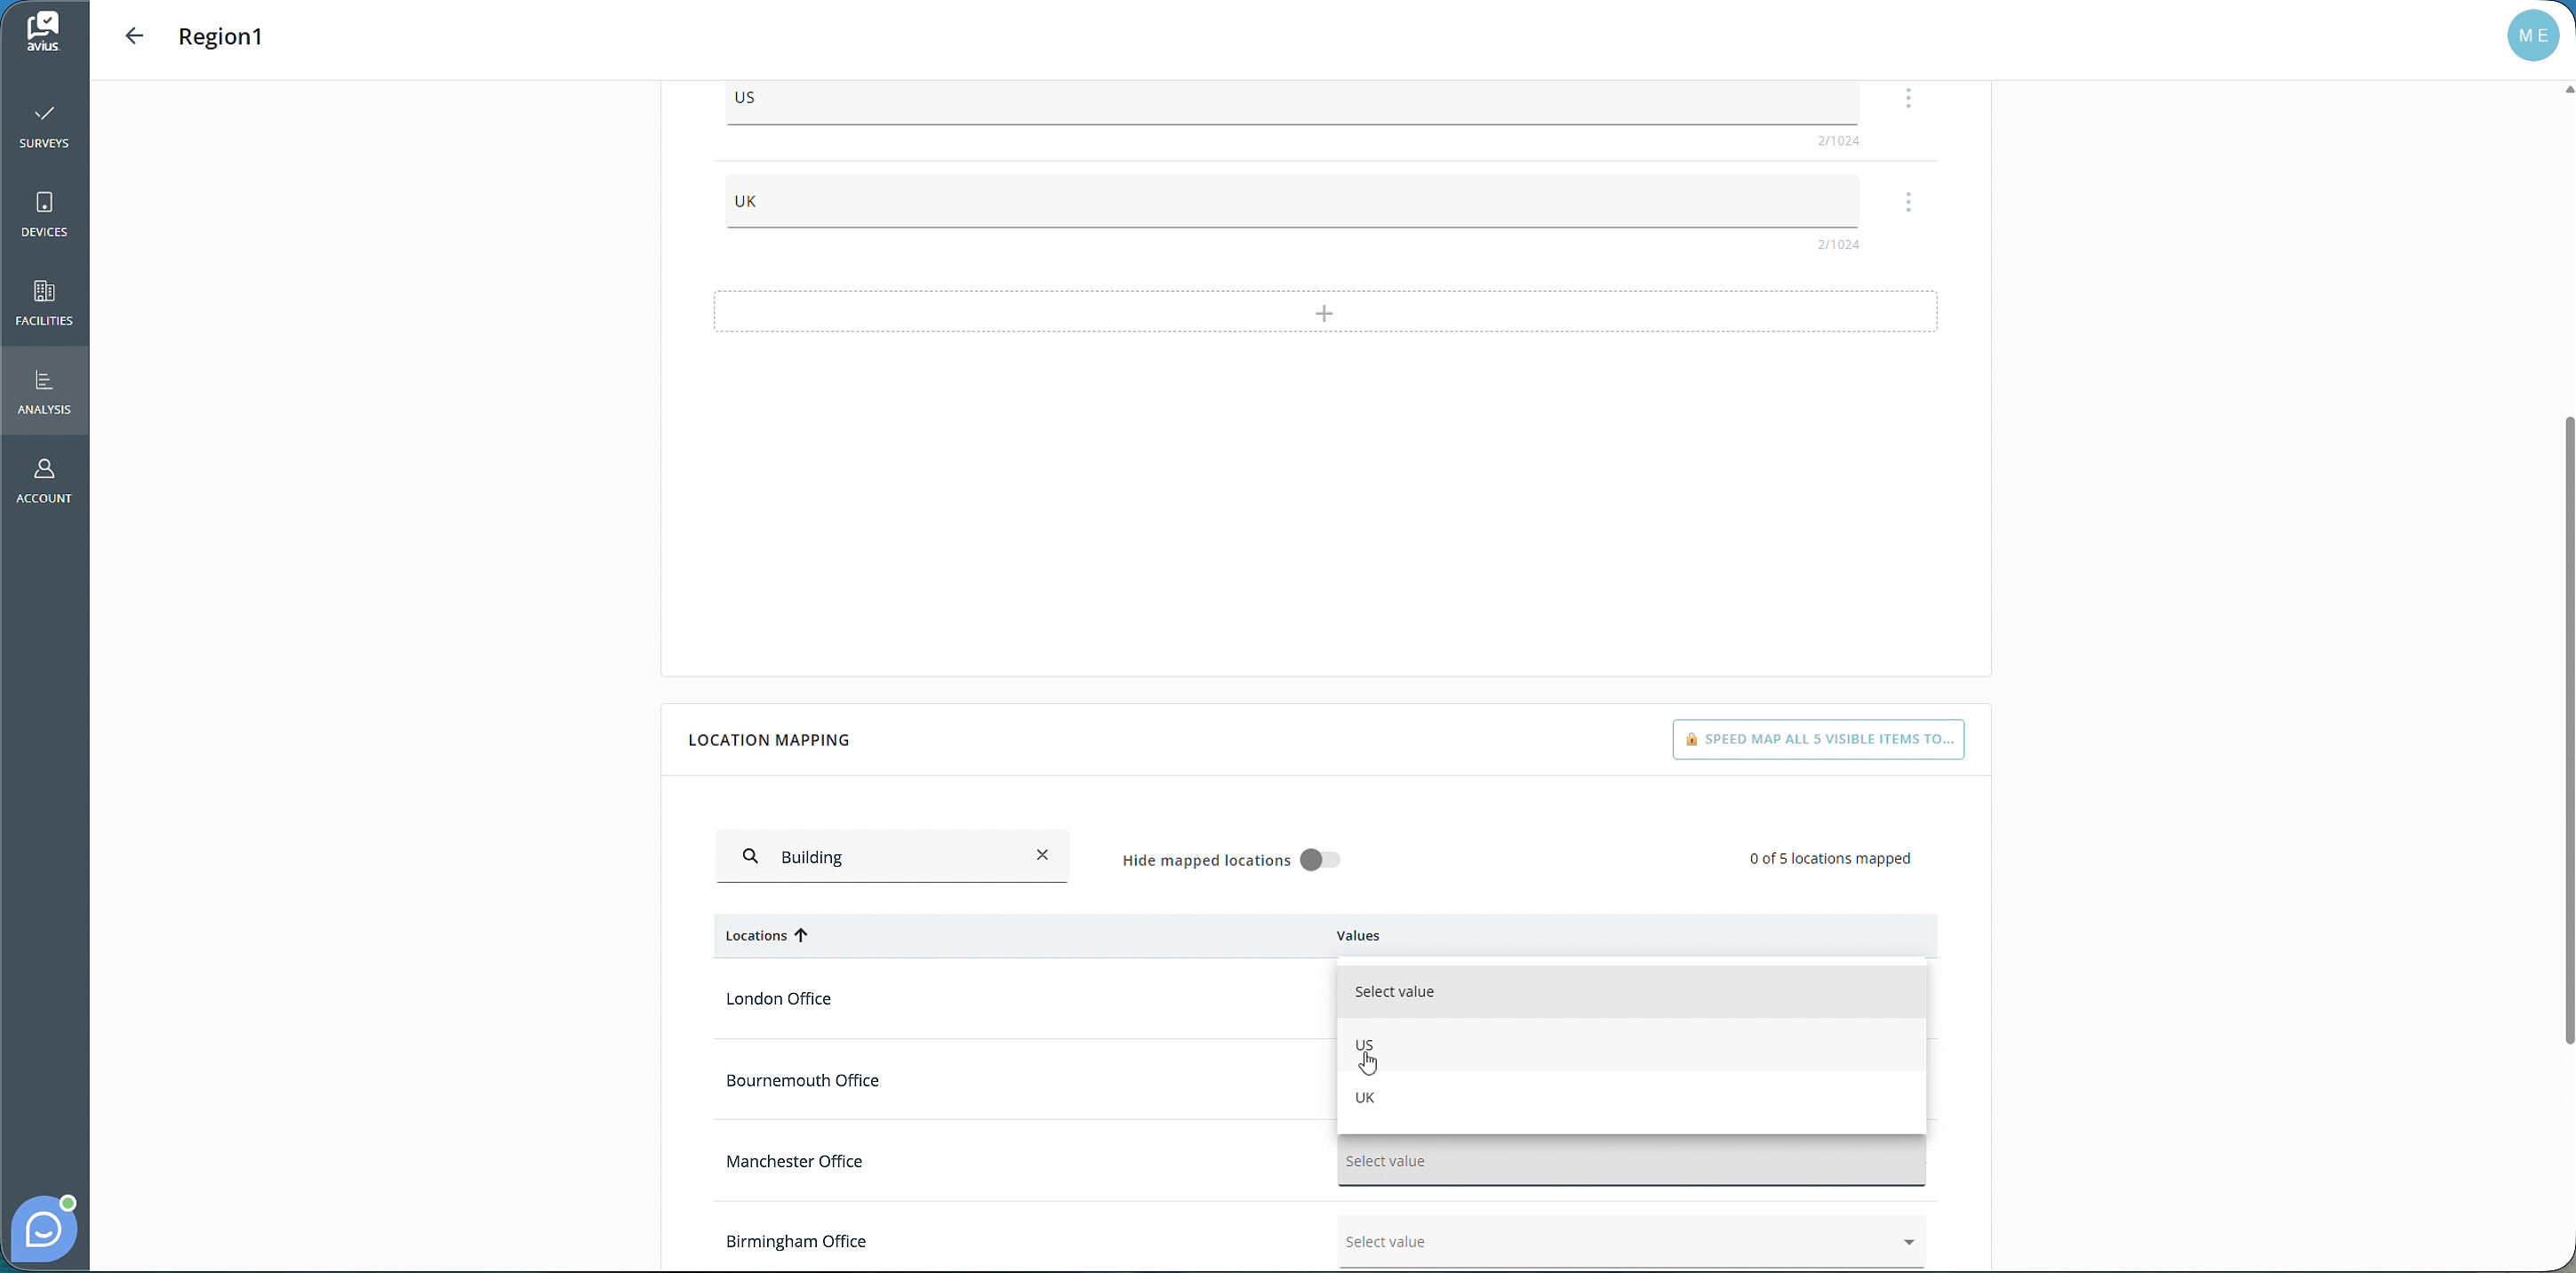
To assign values:
- Use the search box to find a specific location or collector, or scroll through the list.
- In the Values column, select the value you wish to assign.
- If the Comparison Point is configured as Multi Value, you can select multiple values for the same location or collector.
In the top-right corner of this section, you can view how many locations or collectors have been mapped. You can also enable the Hide Mapped Locations/Collectors toggle to display only locations or collectors that have not yet been assigned a value.
Click for more detail
Click for more detail
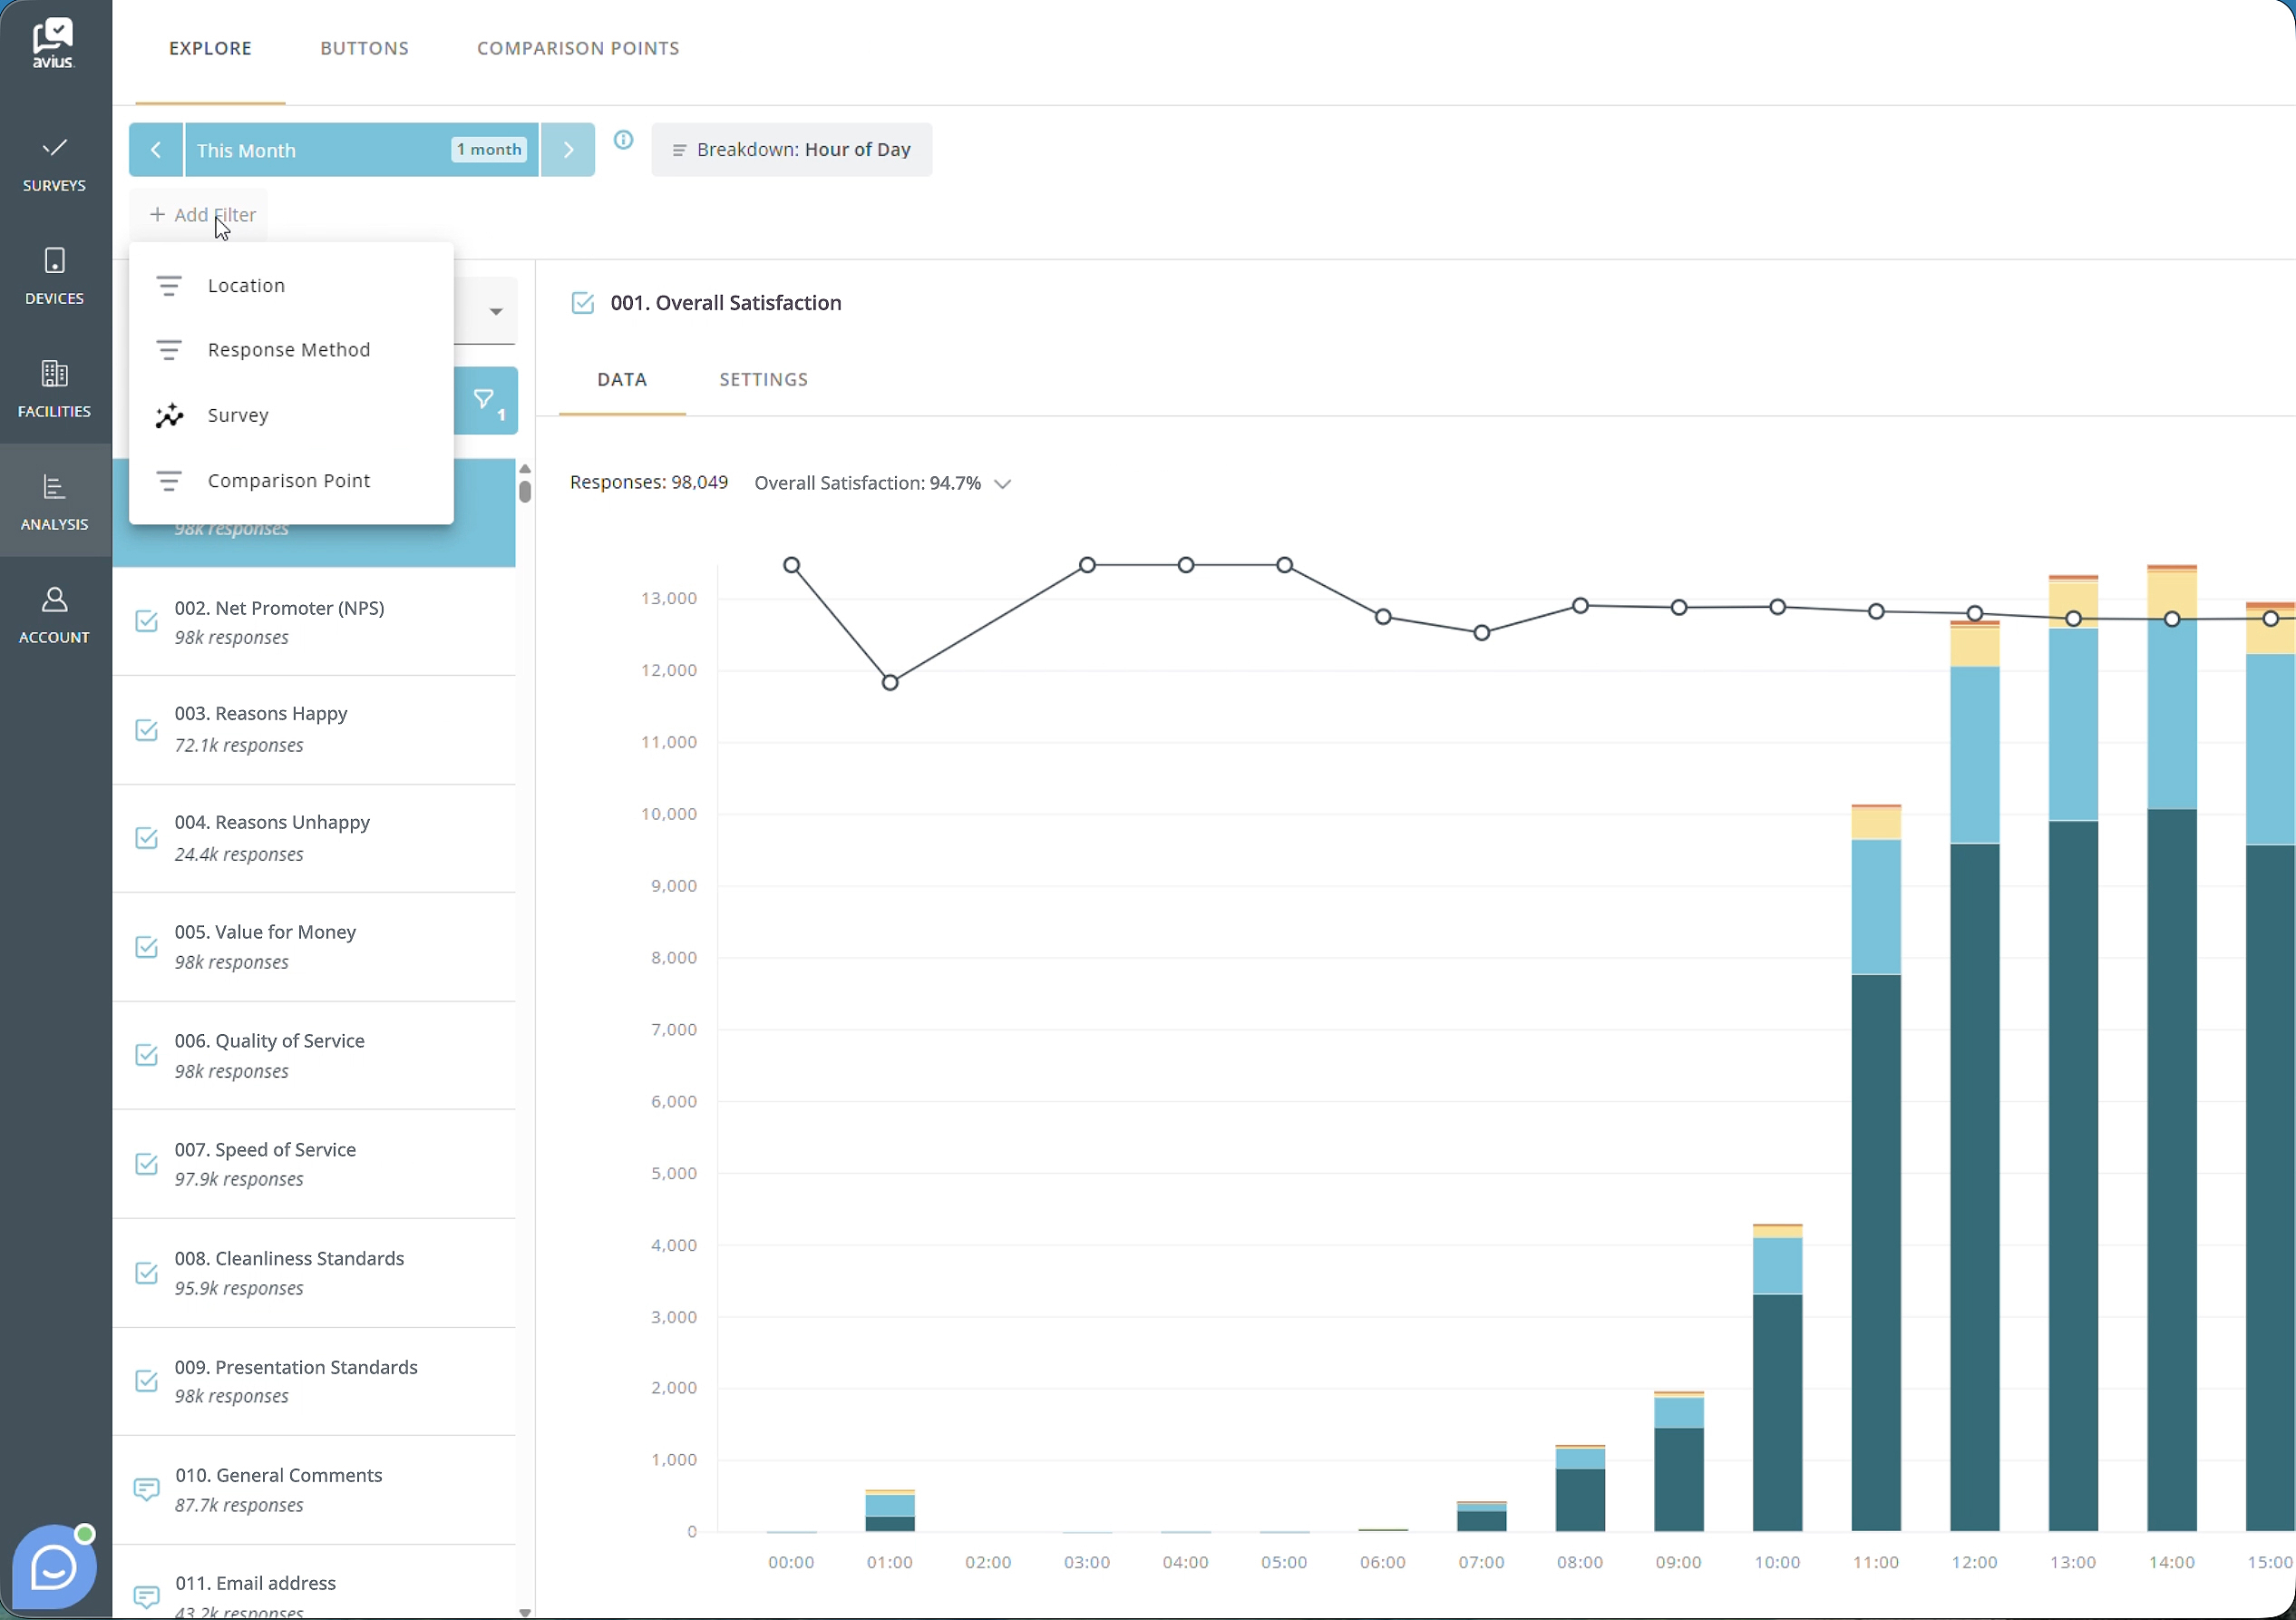
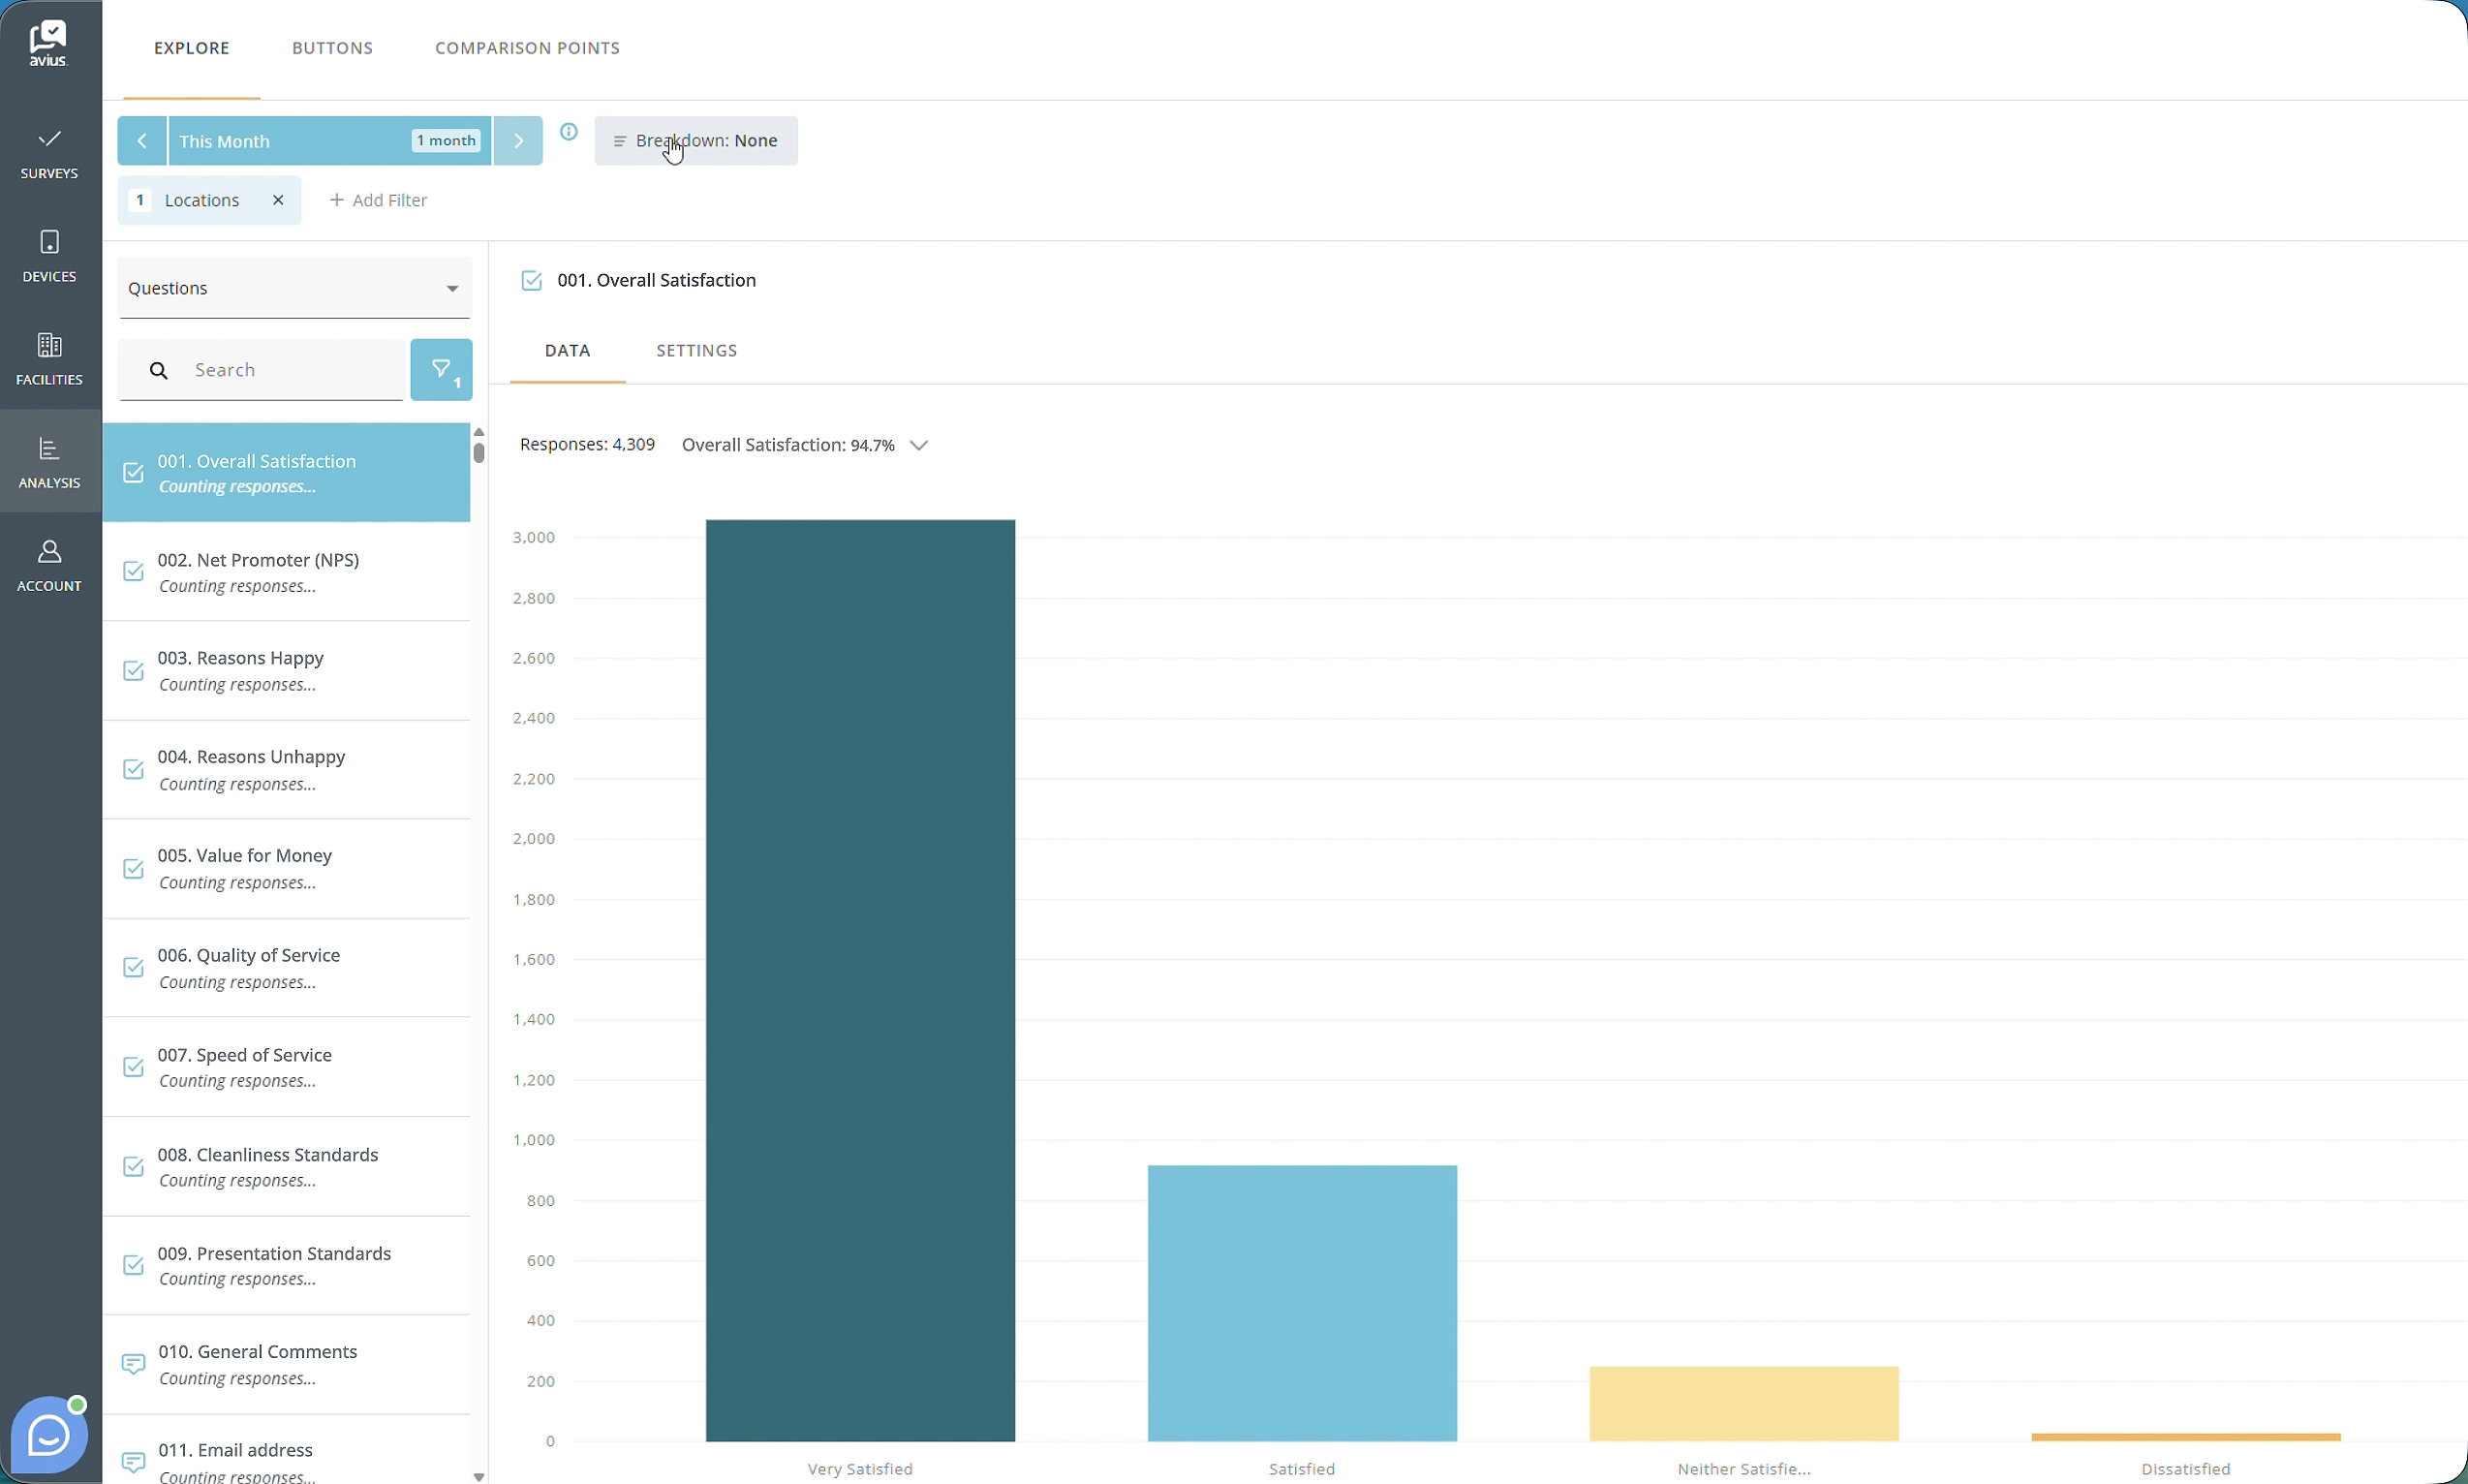
ADDING FILTERS
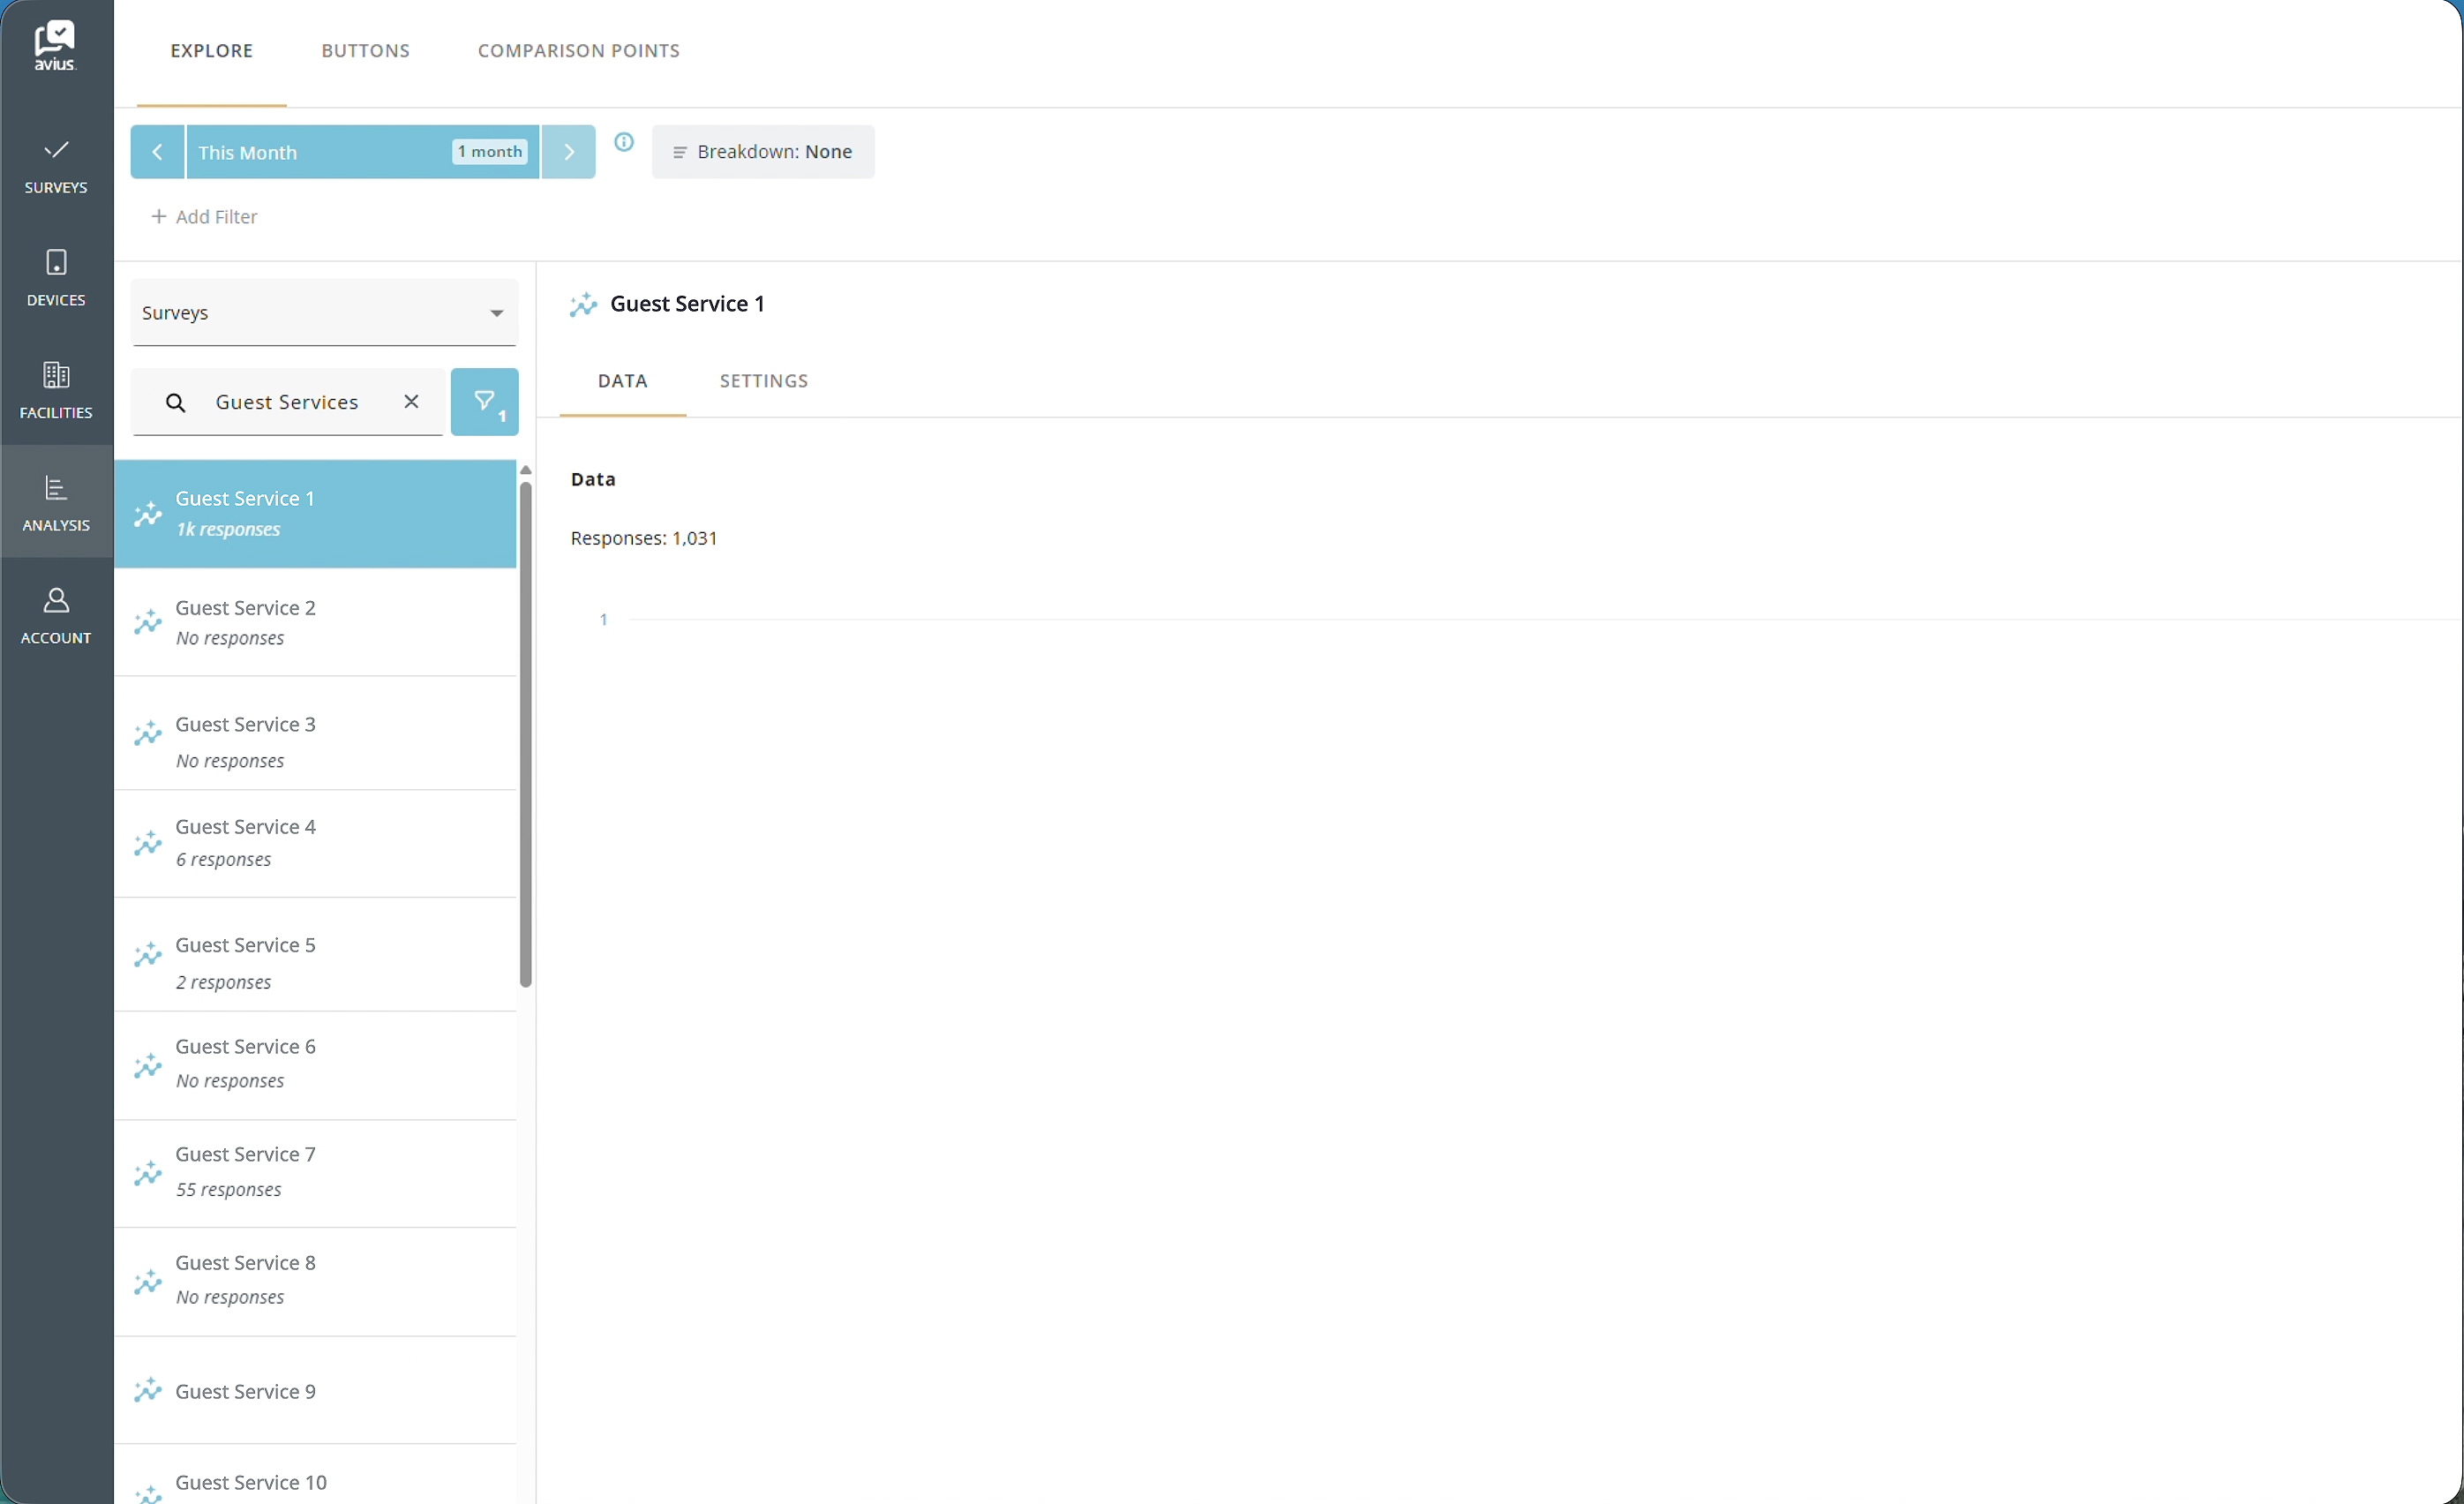
To filter your data in the Explore tab, click Add Filter below the blue date filter.
You can filter data using the following options:
- Location
- Response Method
- Survey
- Comparison Point
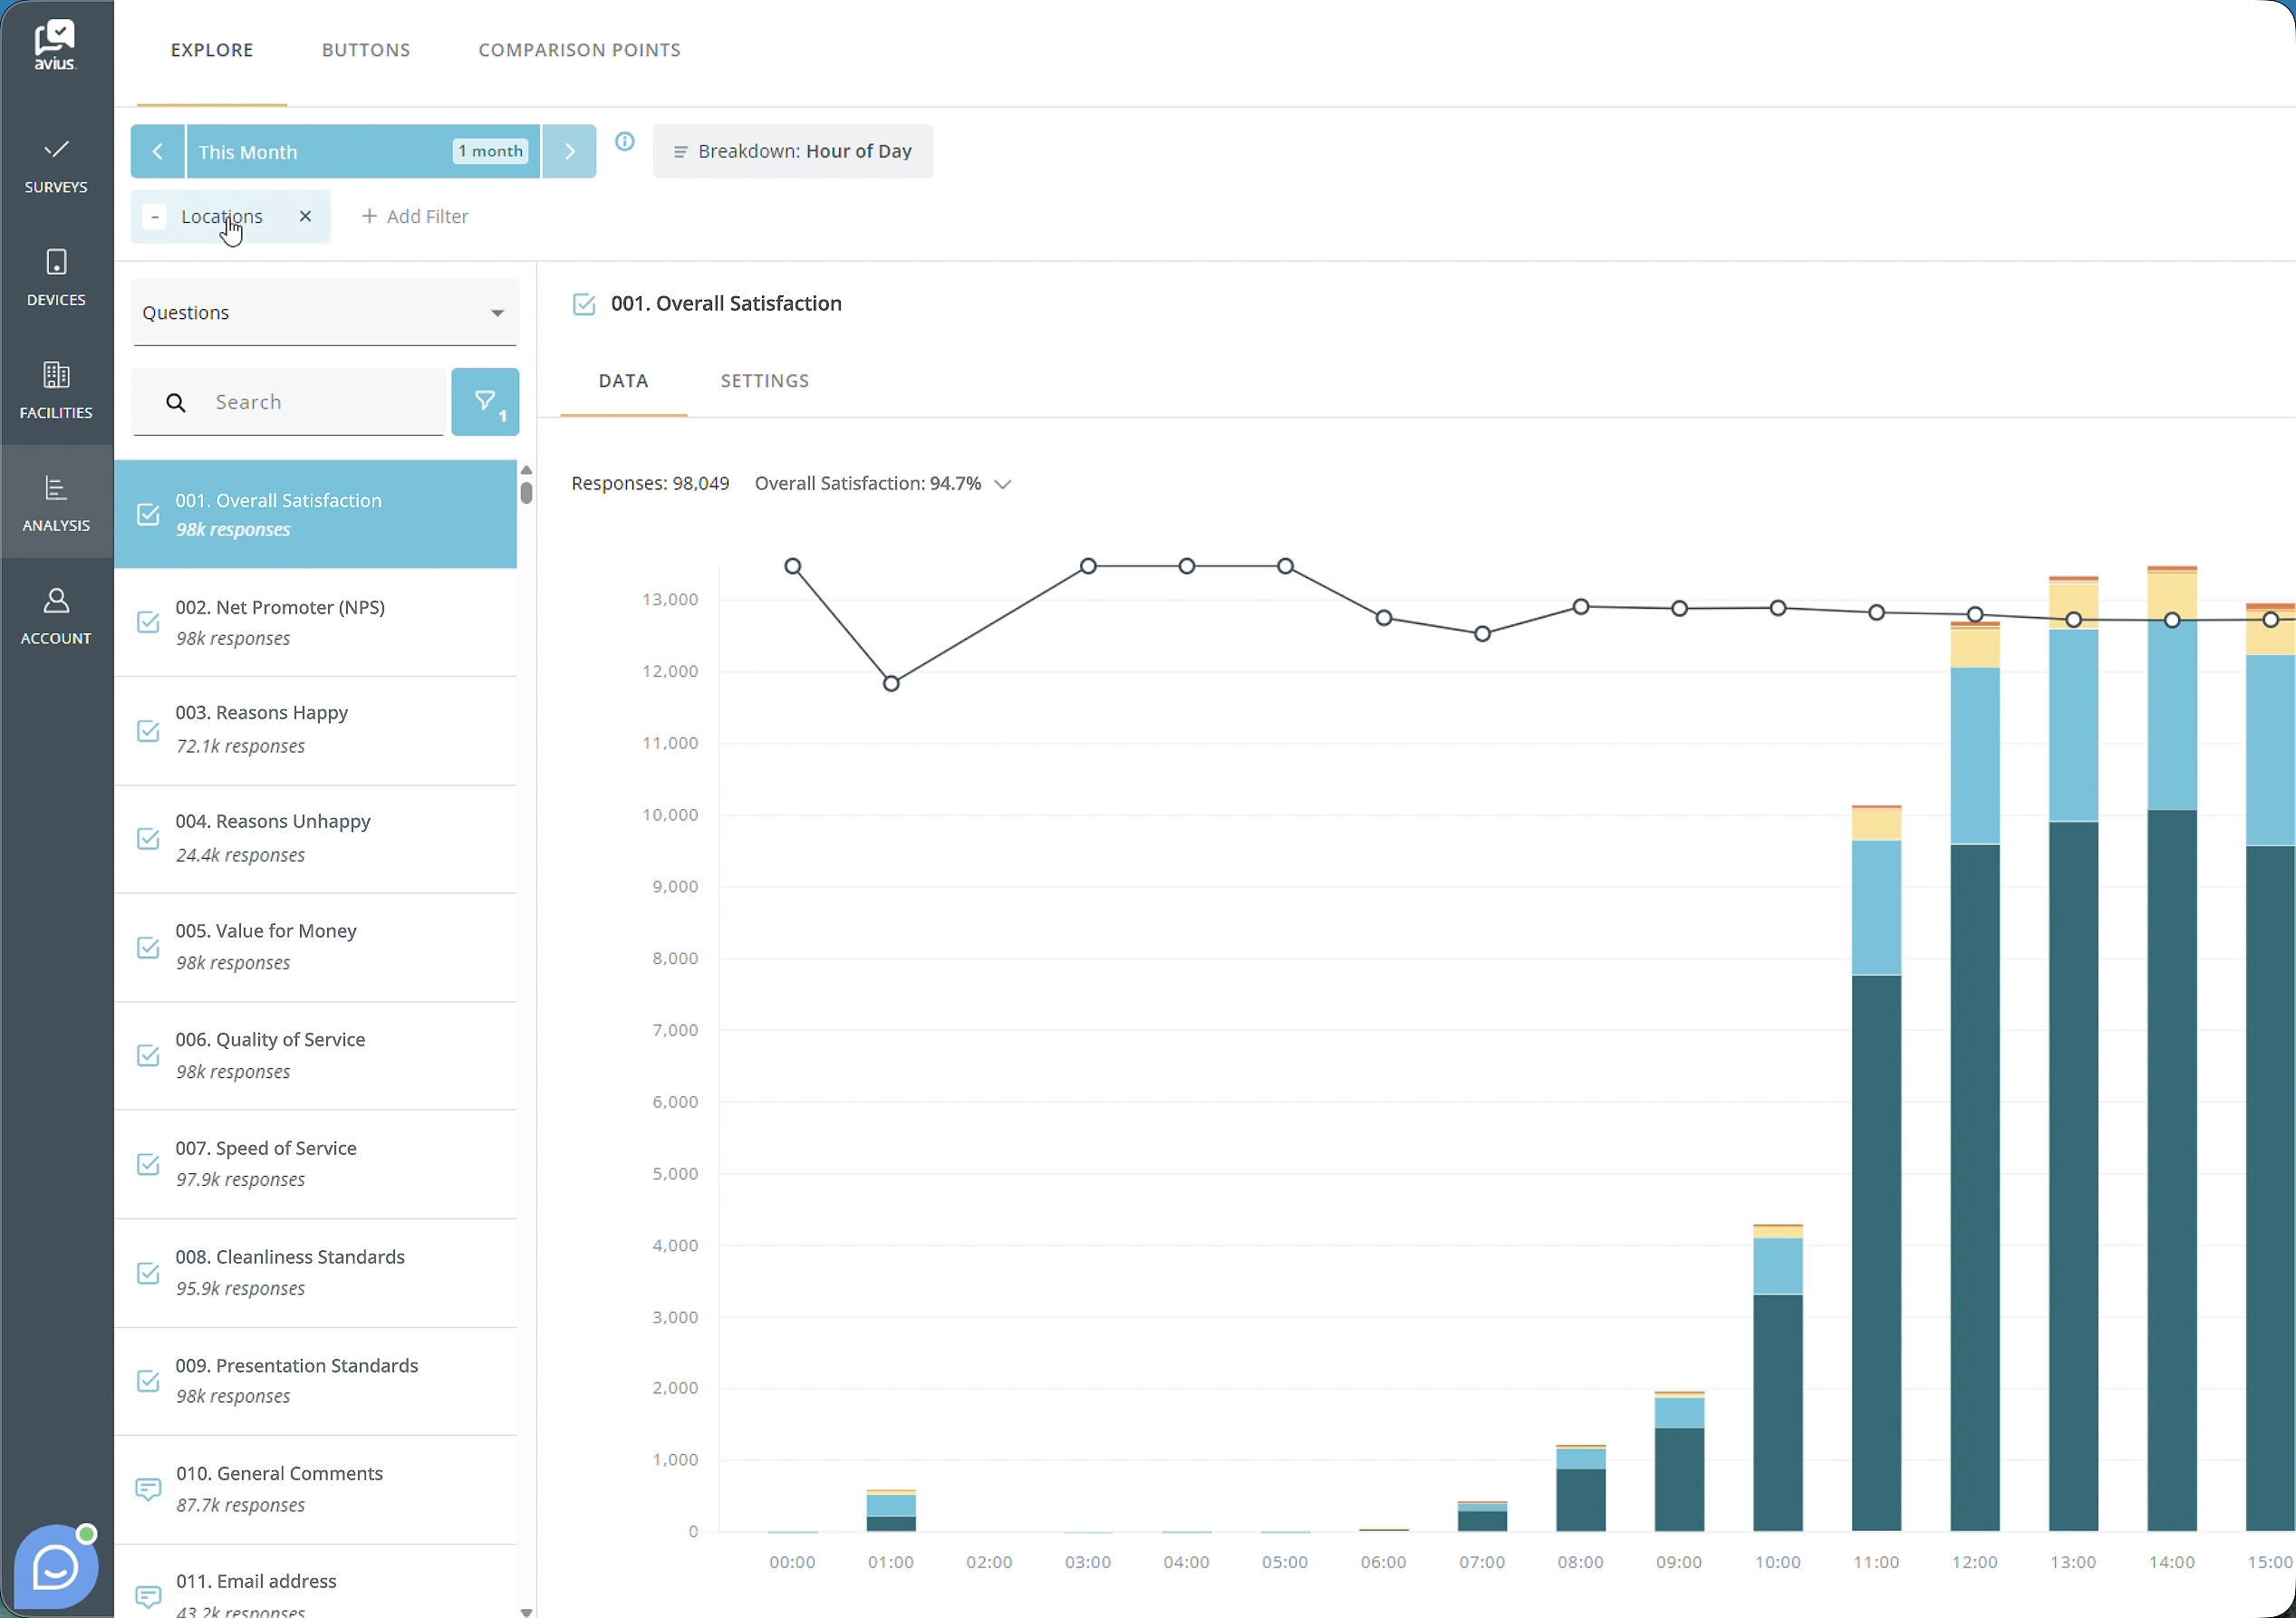
After selecting a filter type, it will appear in a row below the date picker. To add additional filters, click Add Filter again and select another filter type.
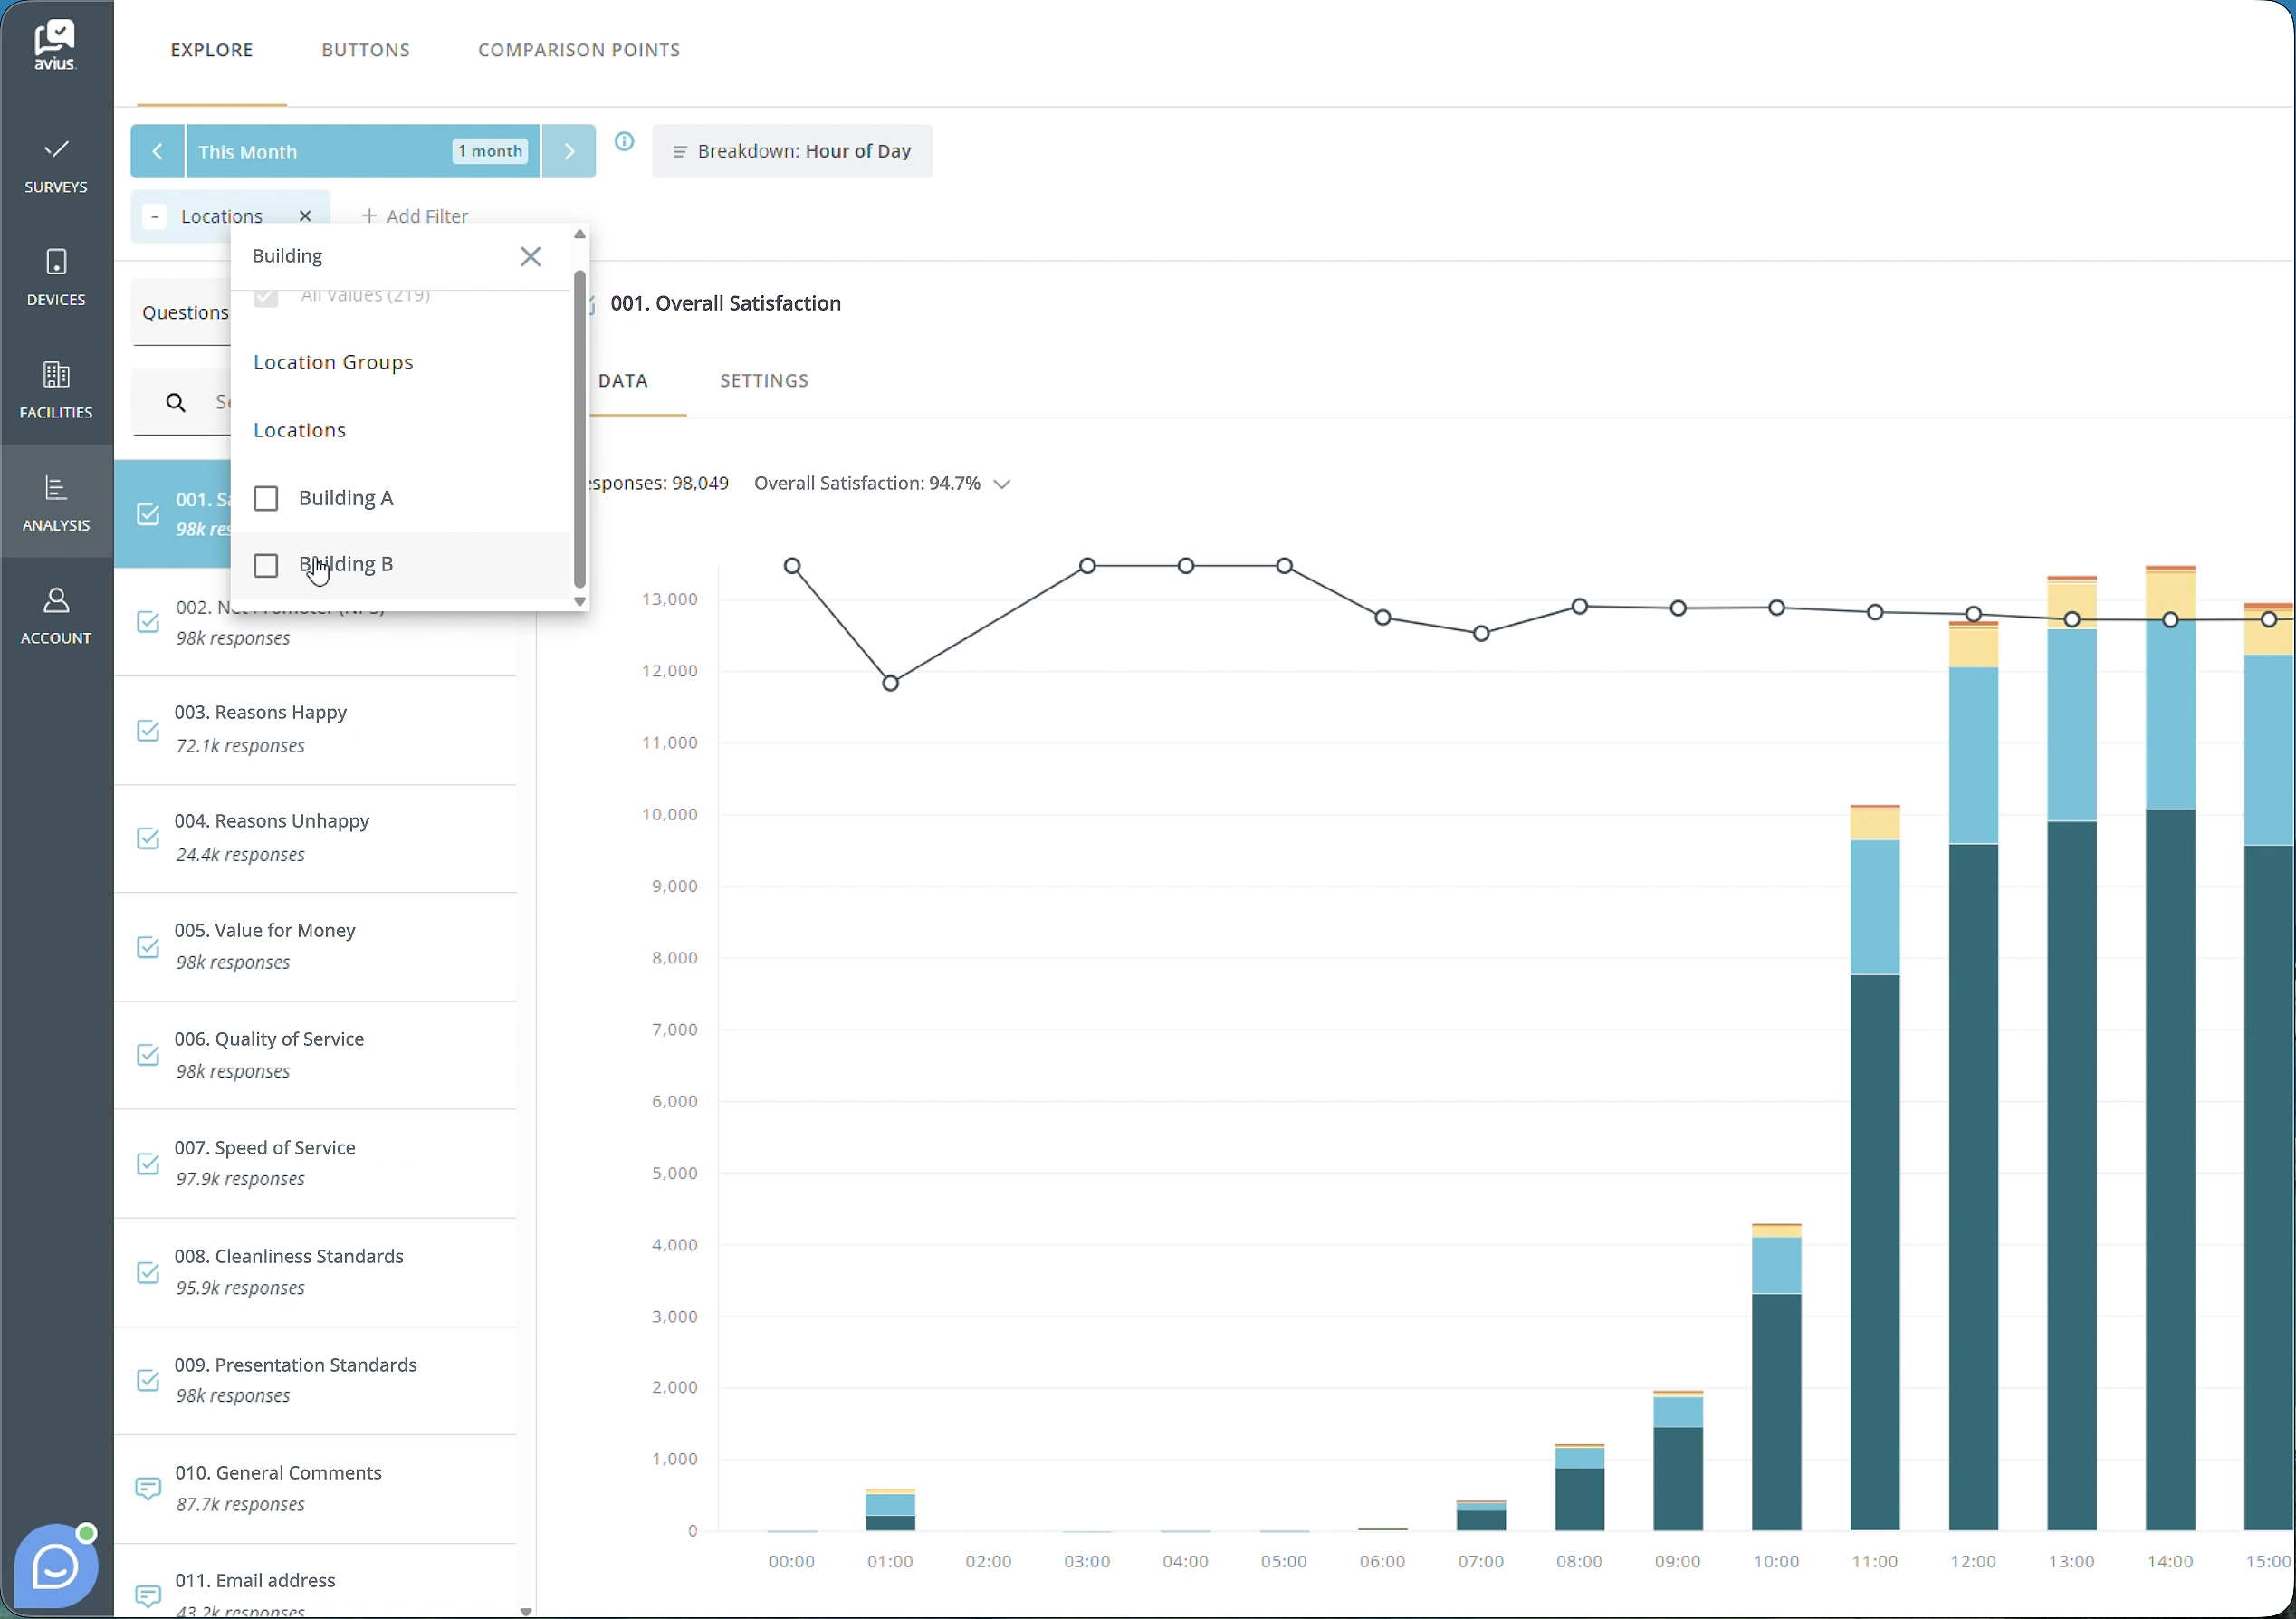
Once you have added the filters you want to use, click the filter name to open a list of available filter options. Select the values you would like to include in your analysis.
To remove a filter, click the X next to the filter name.
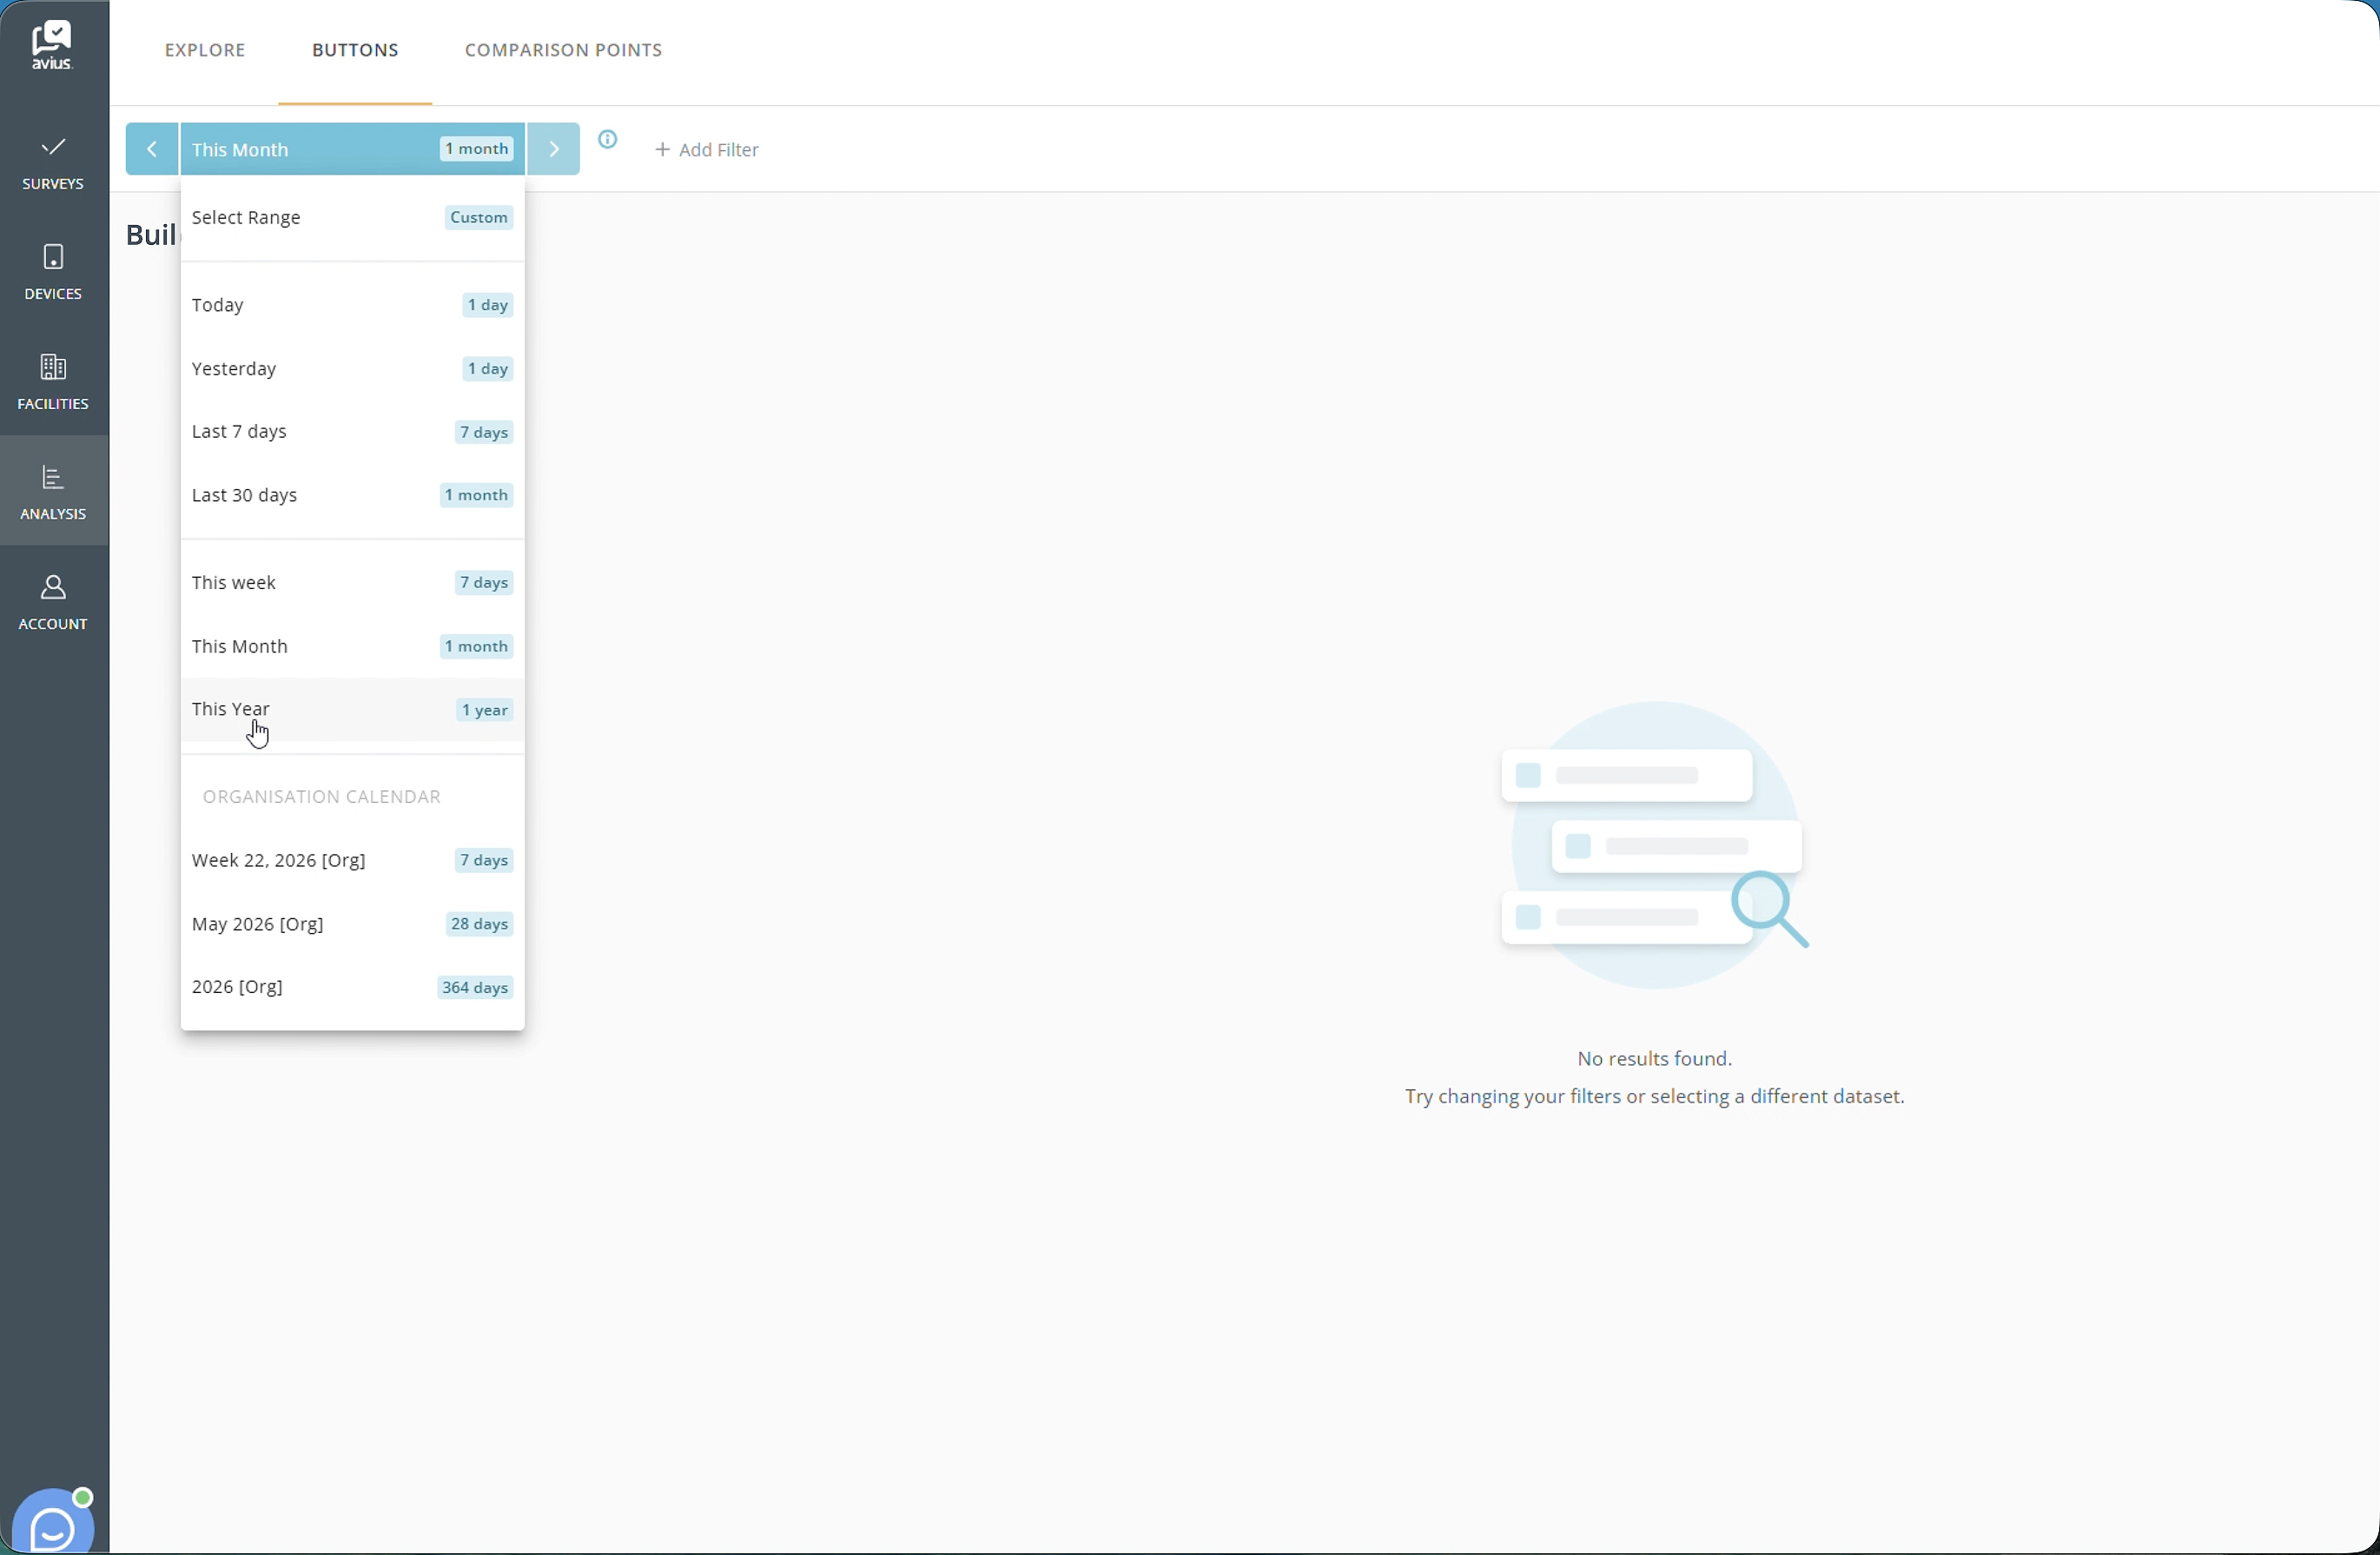
APPLYING DATE FILTERS
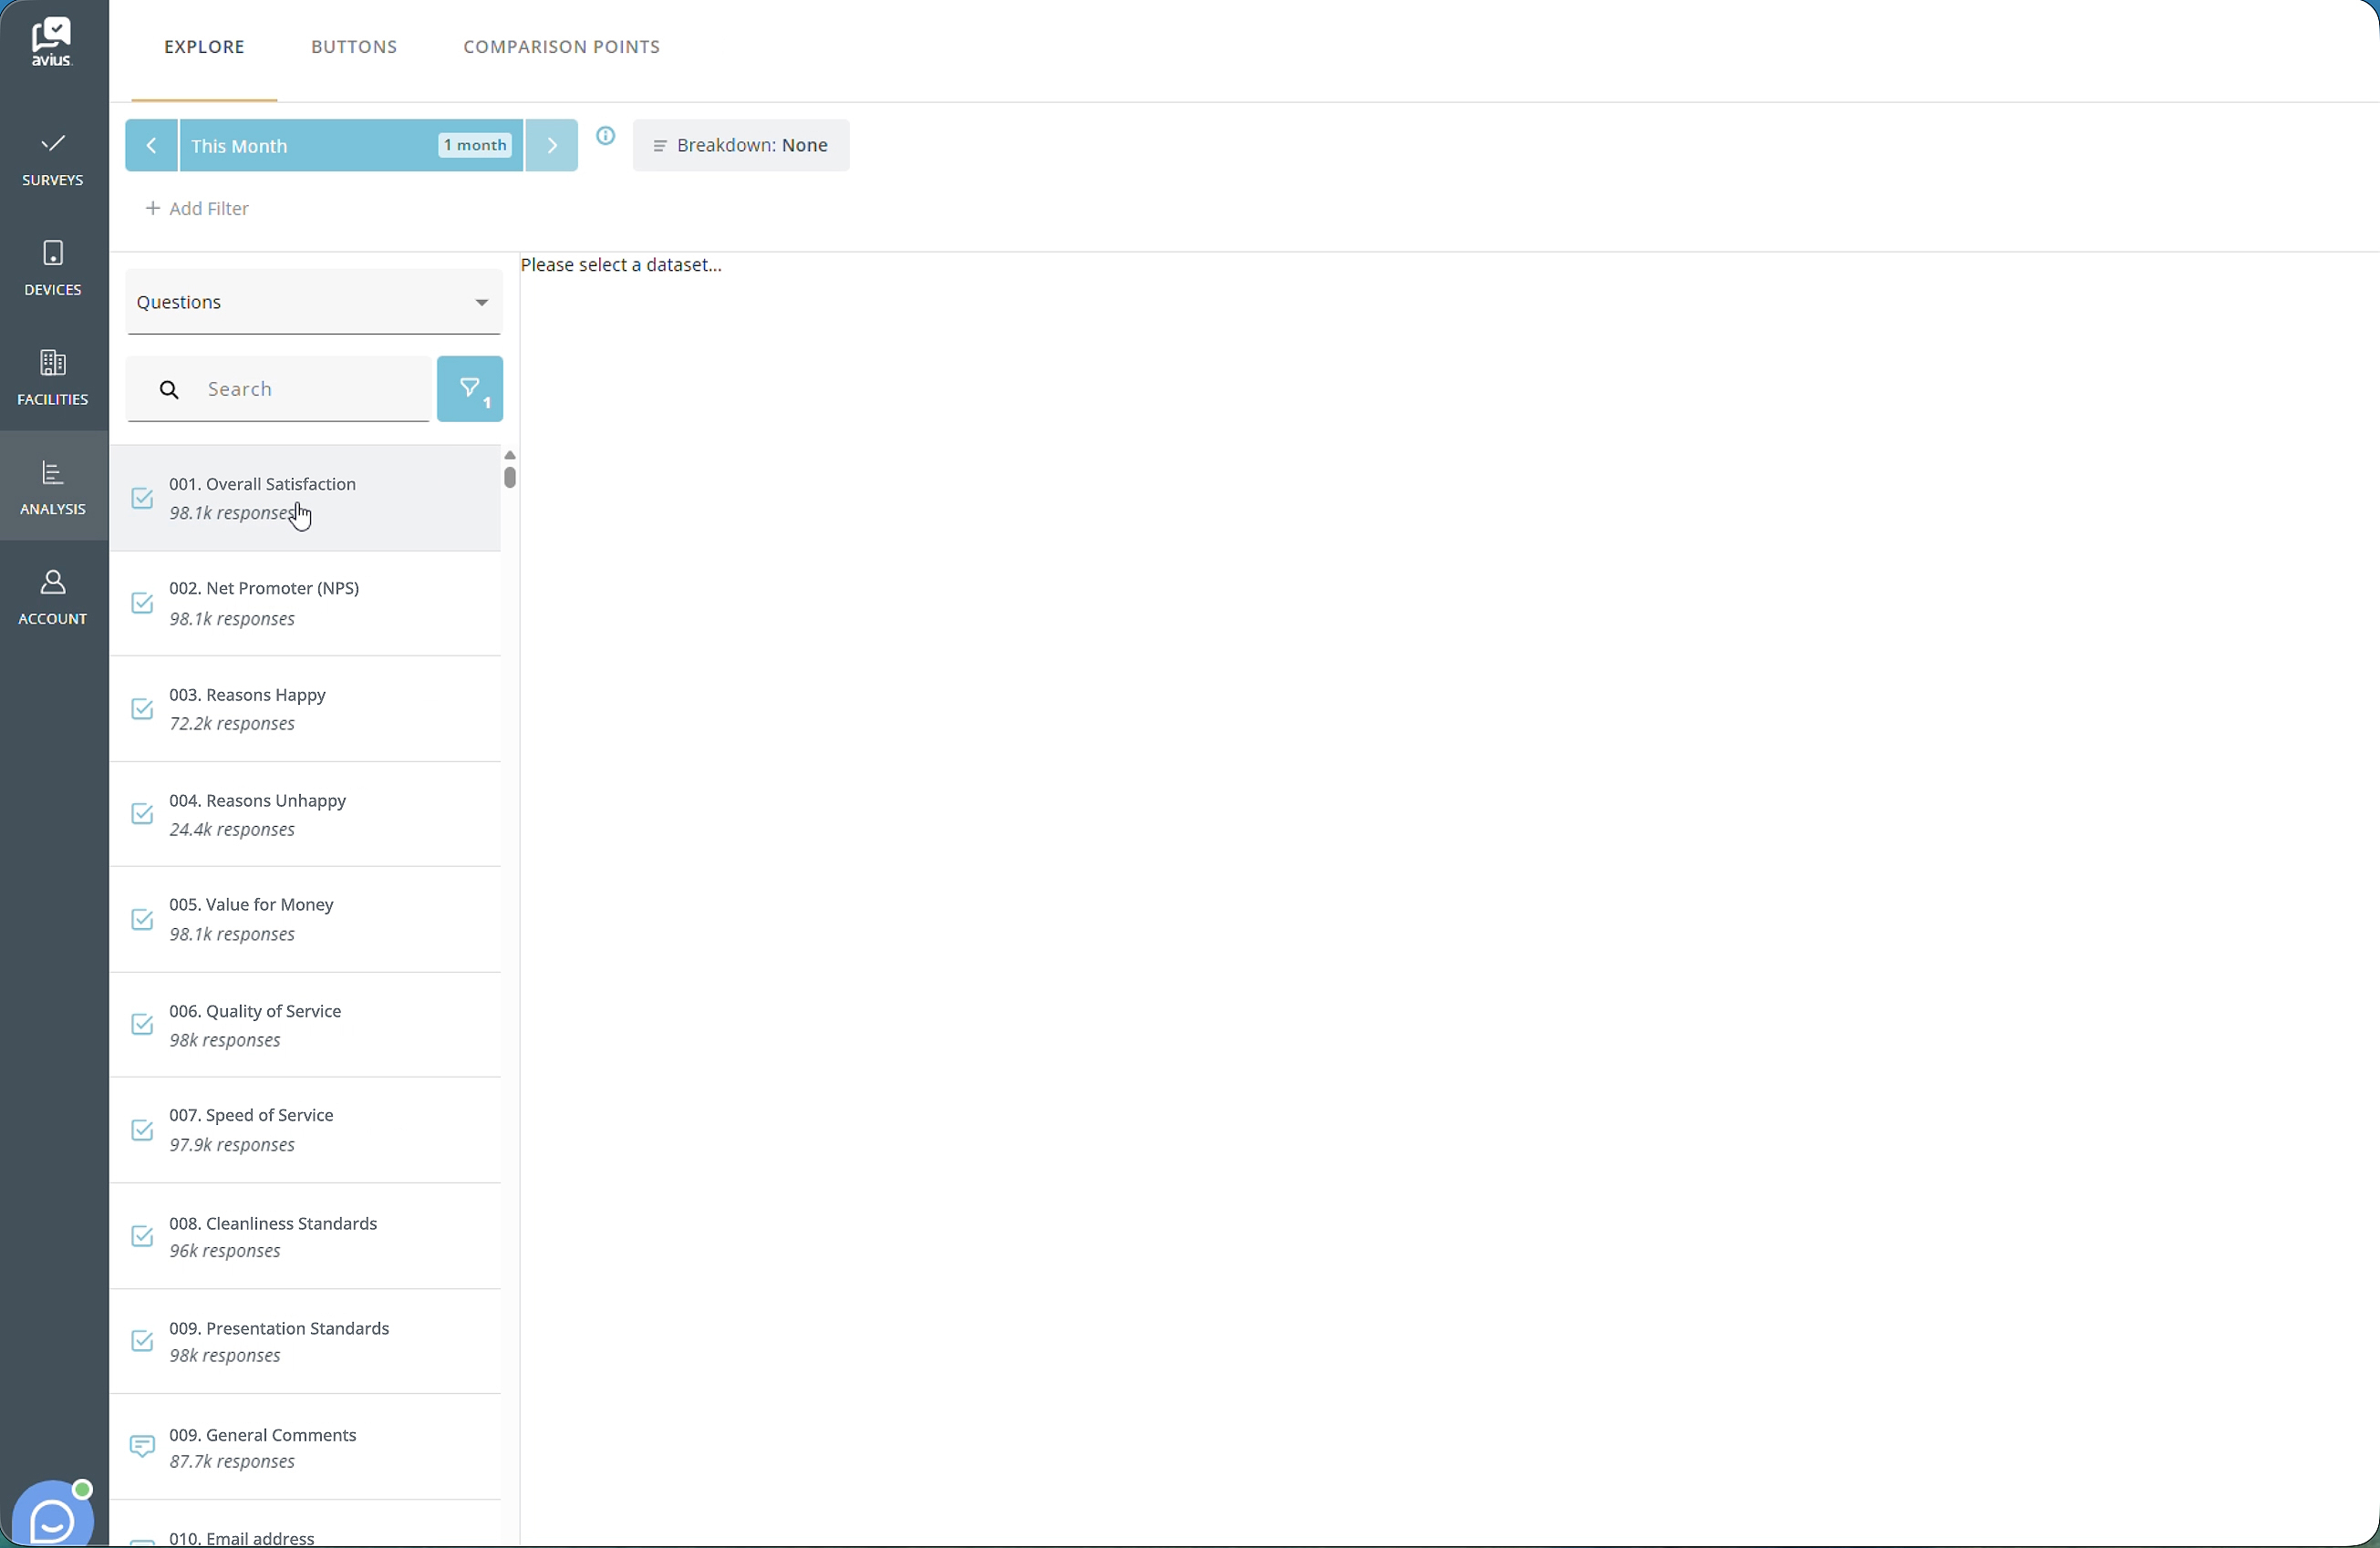
To change the date range used in Explore, click the blue date filter box in the top-left corner of the page. By default, this is set to This Month.
A dropdown menu will appear containing a range of preset date options. If your organisation uses an Organisation Calendar, any configured calendar periods will also be available for selection.
You can also choose a Custom Range from the top of the dropdown menu. To apply a custom date range:
- Select the start date.
- Select the end date.
- The filter will be applied automatically.
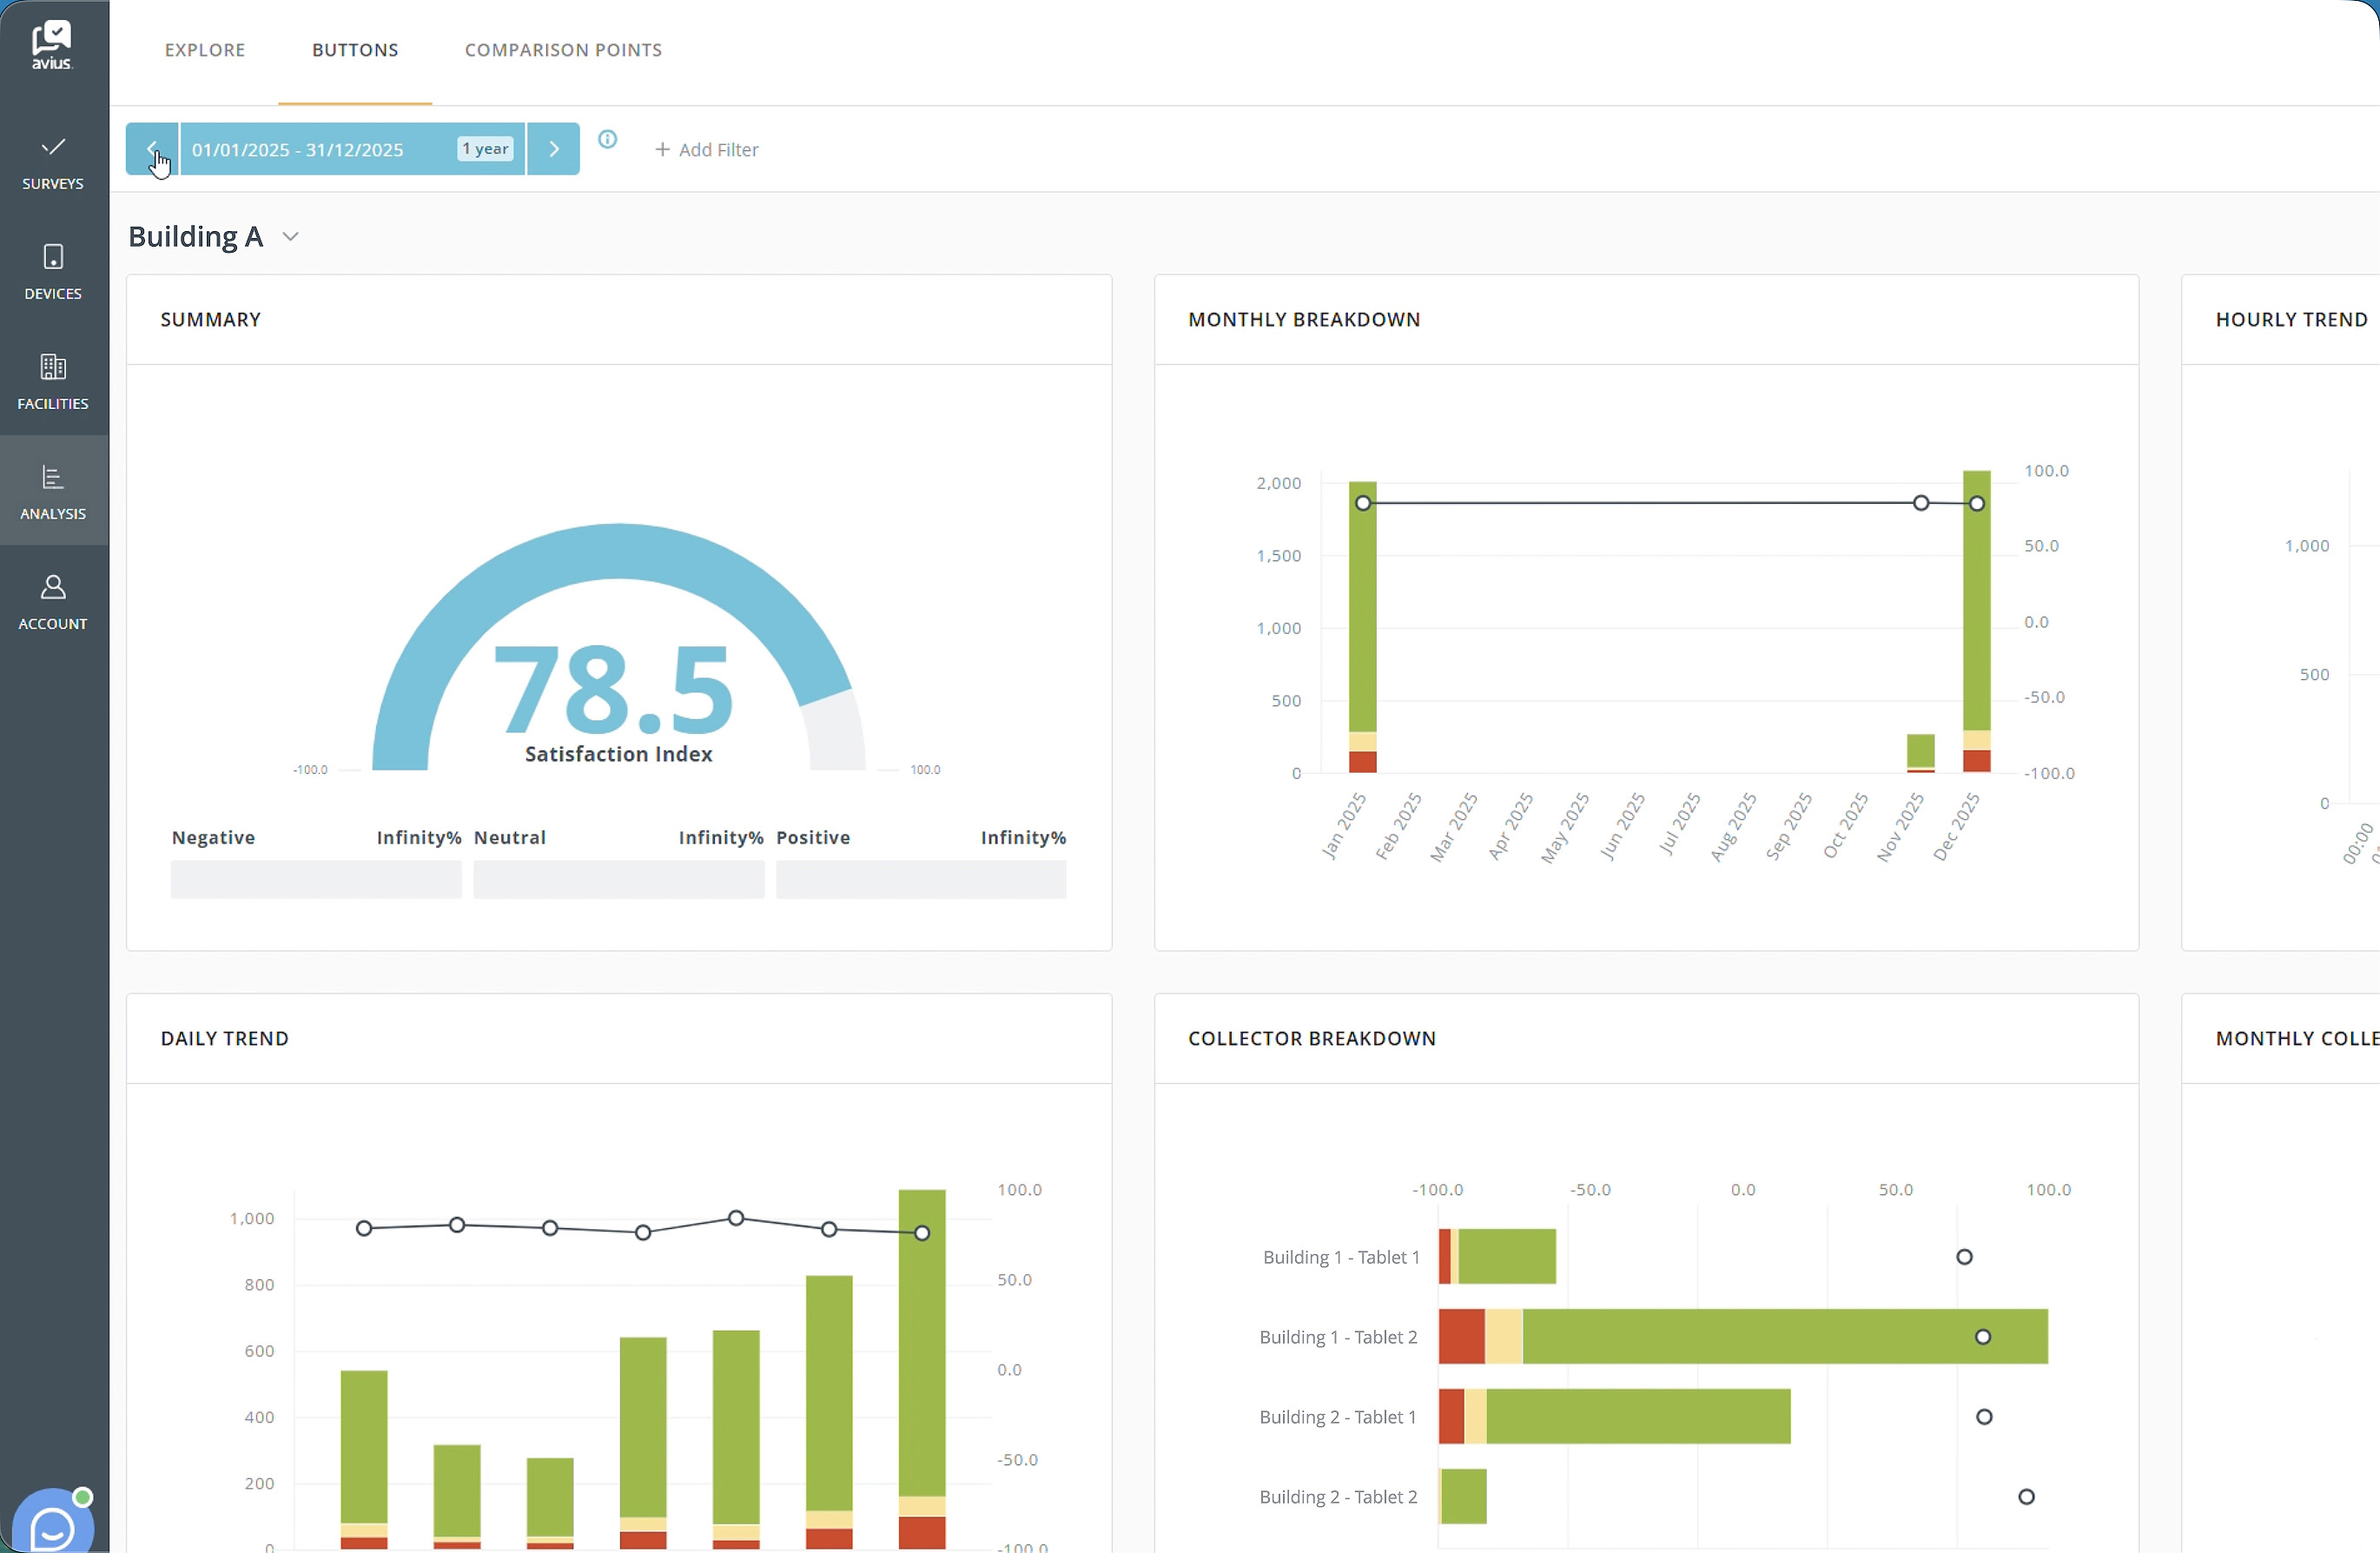
After selecting a date filter, you can use the left and right arrows beside the date filter box to move forwards or backwards through time based on the selected period. For example, if Month is selected, the left arrow will move to the previous month and the right arrow will move to the next month.
Click for more detail
Click for more detail
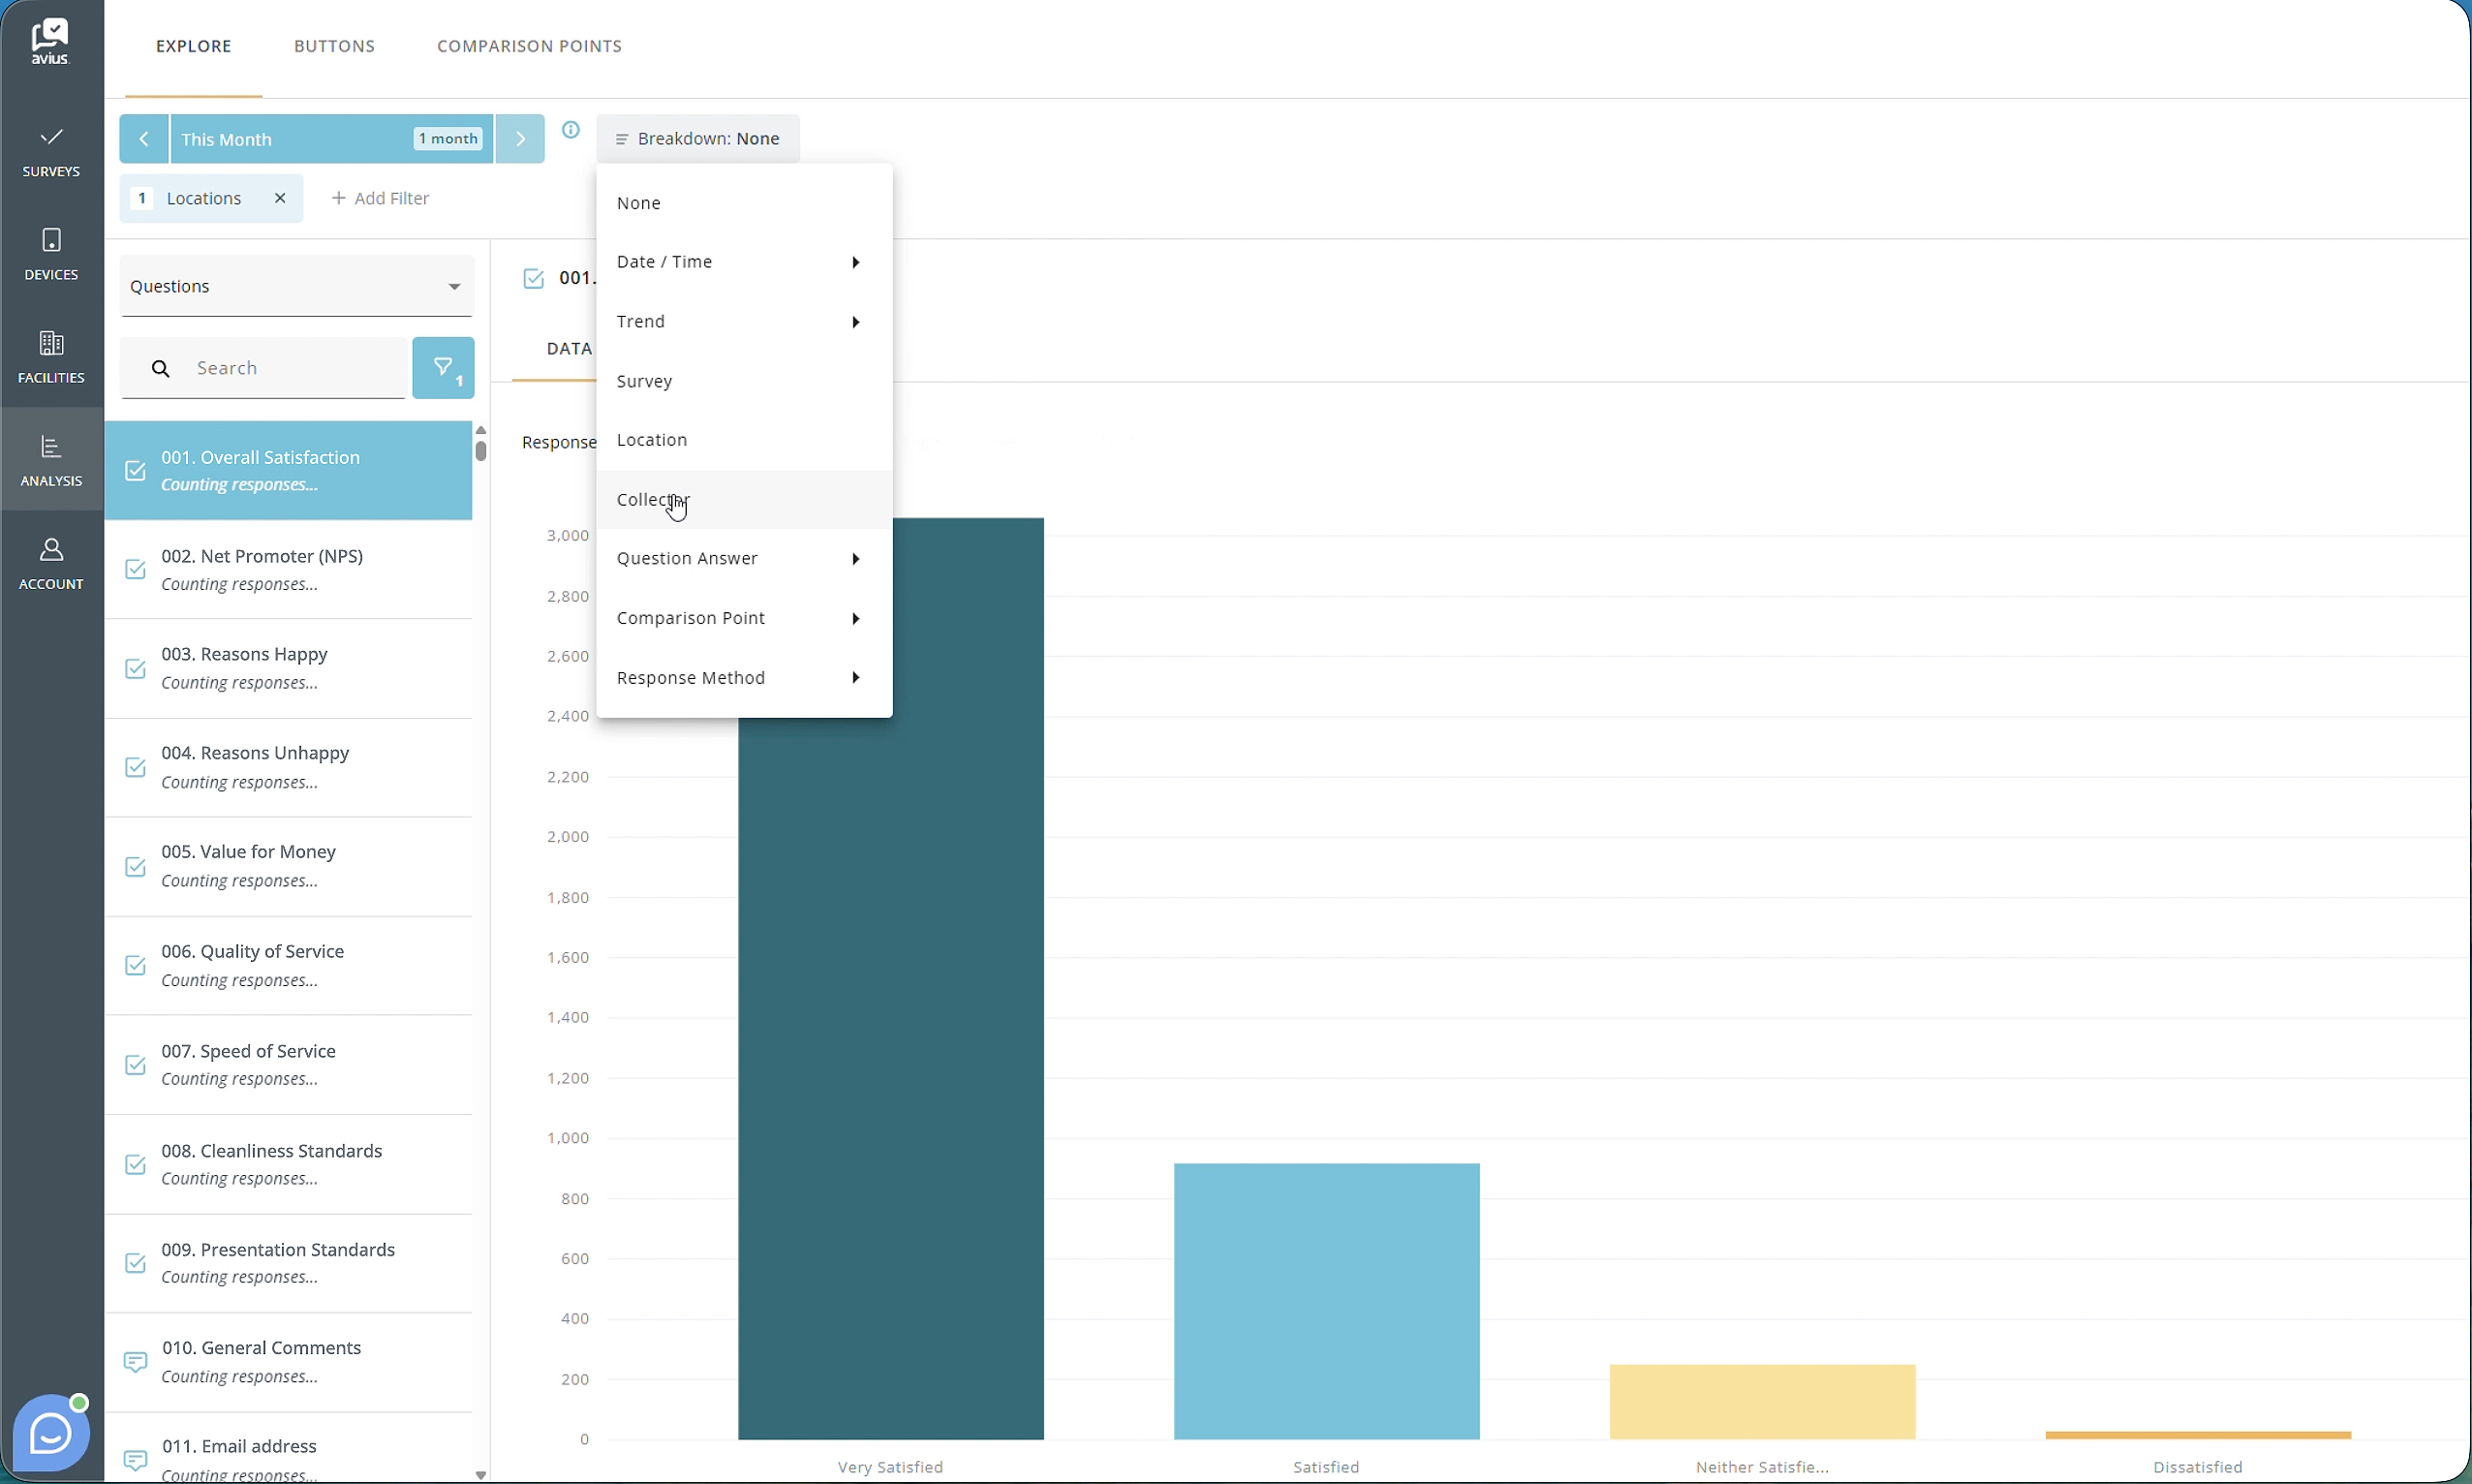
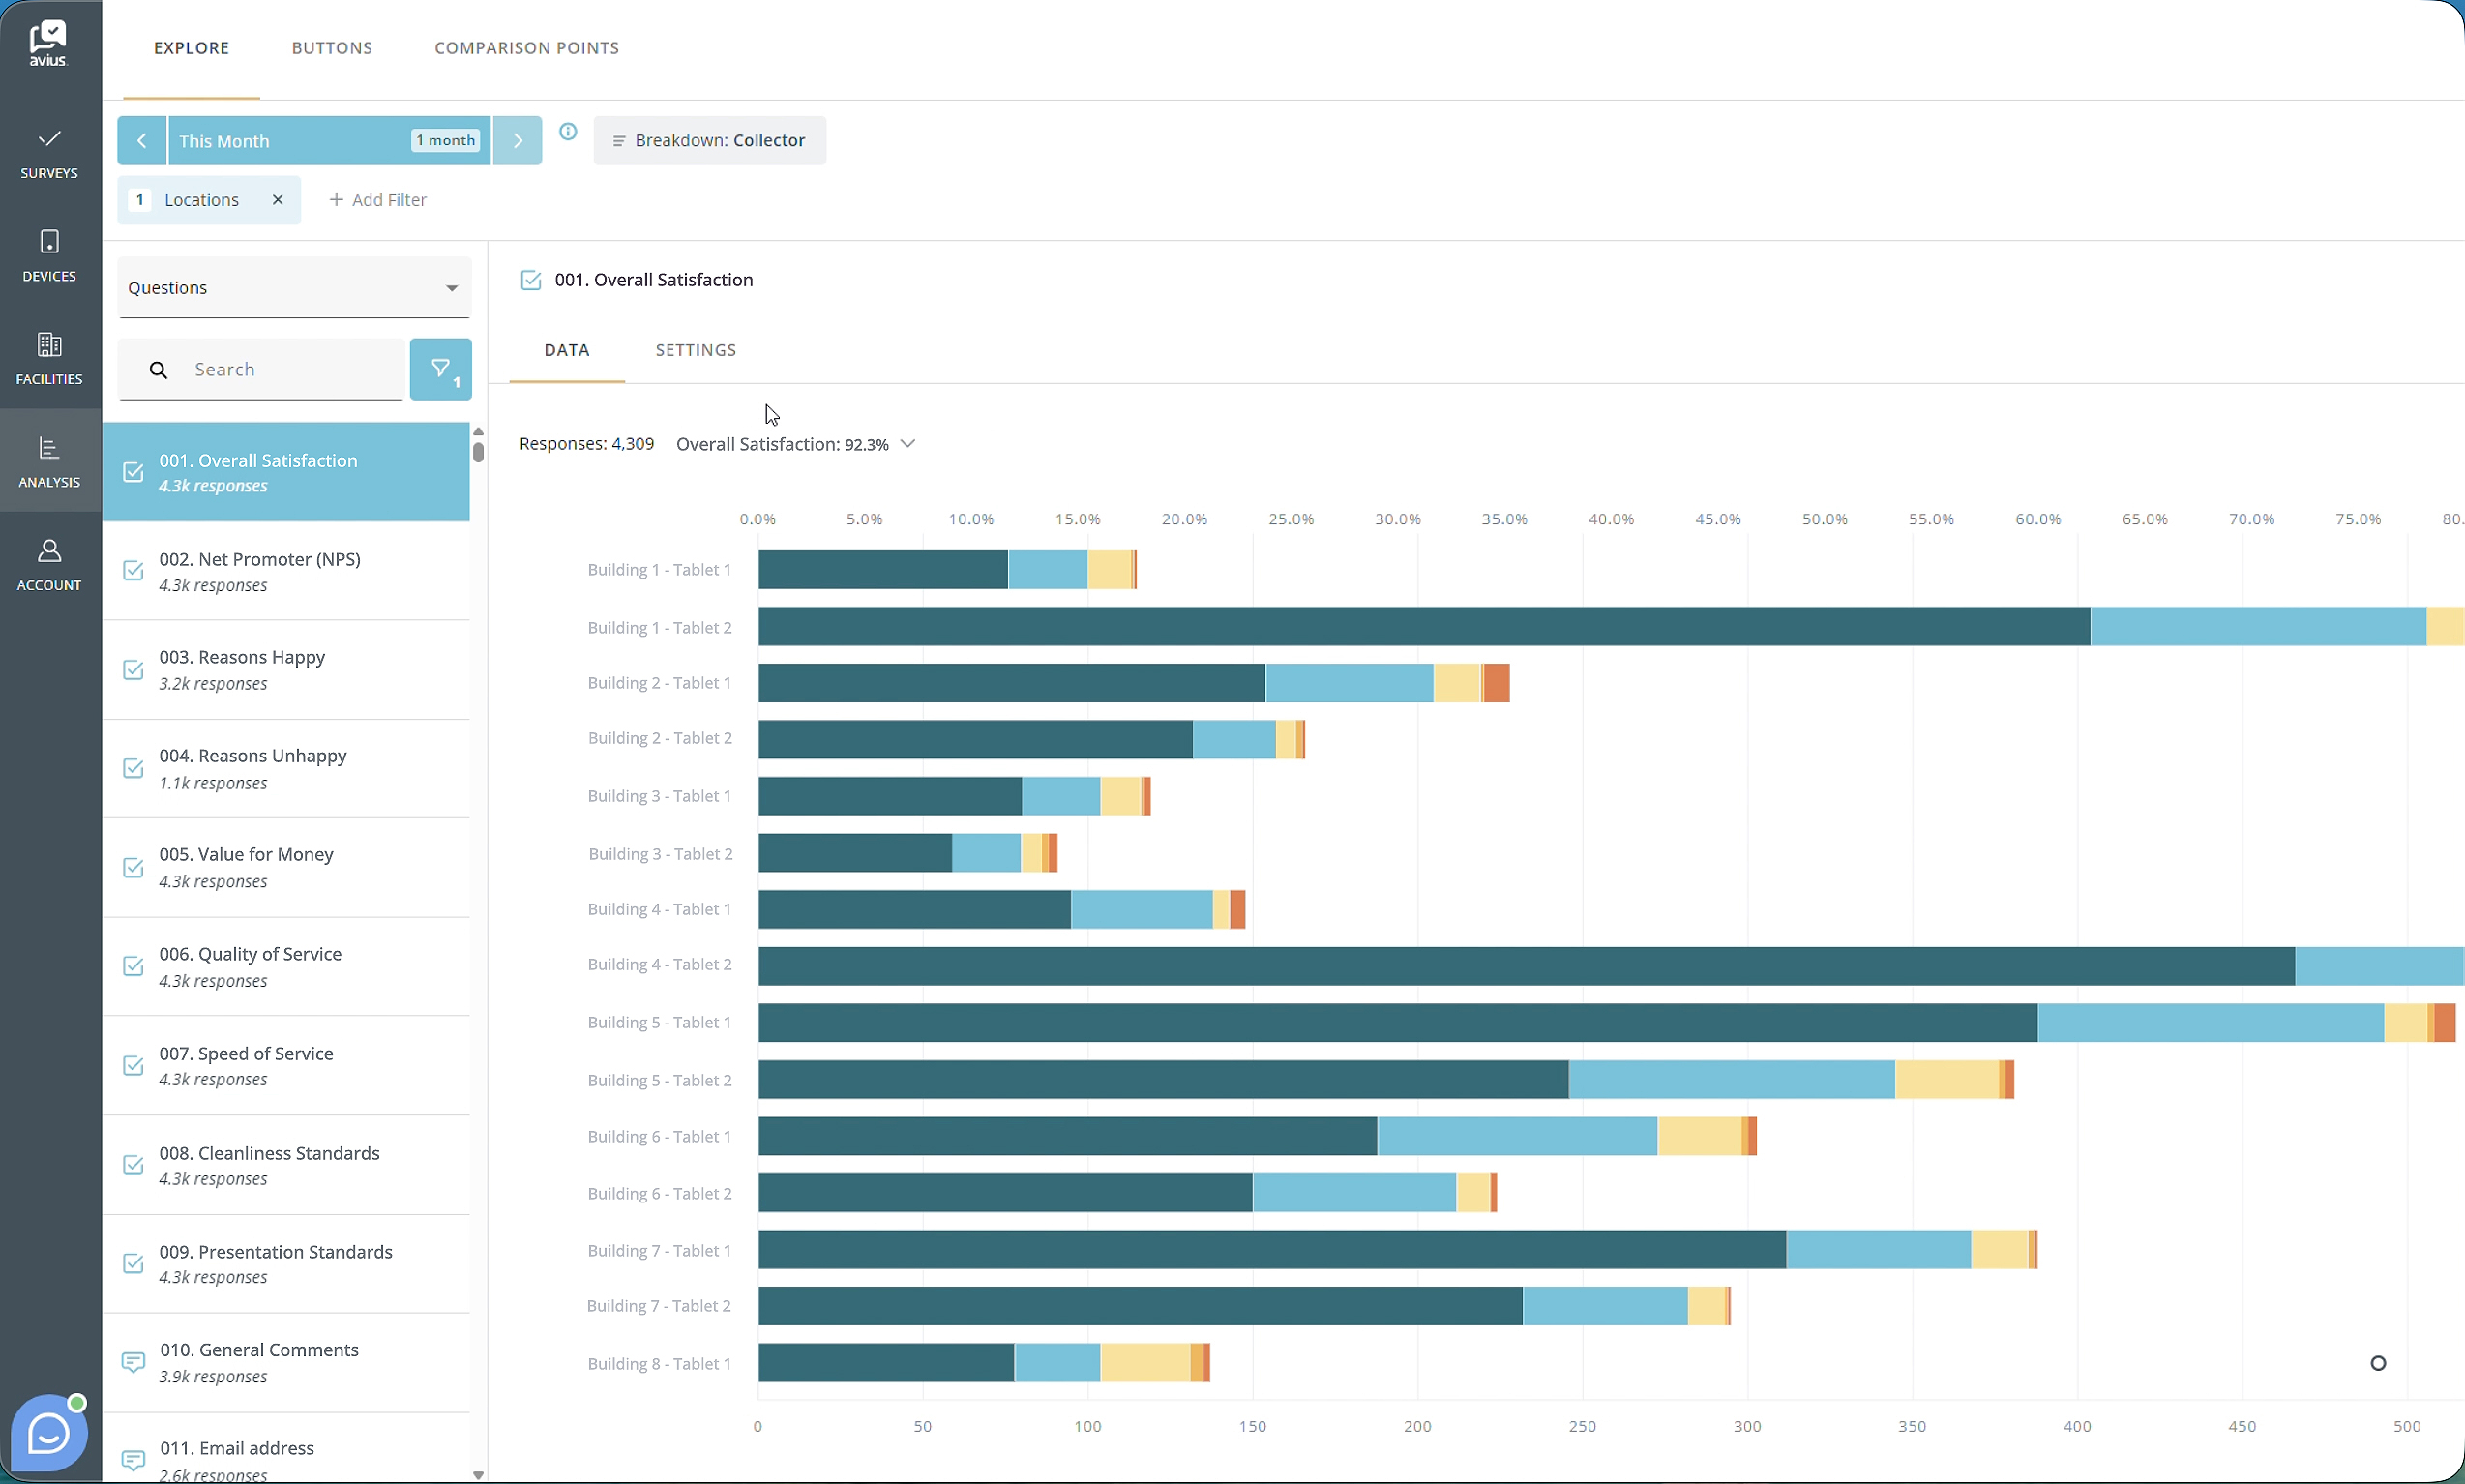
BREAKDOWN AND FILTER BY COLLECTOR
To break down your data by collector, click the Breakdown dropdown next to the date filter and select Collector.
The data will be grouped by the collectors included within your selected filters, allowing you to compare results across different collectors.
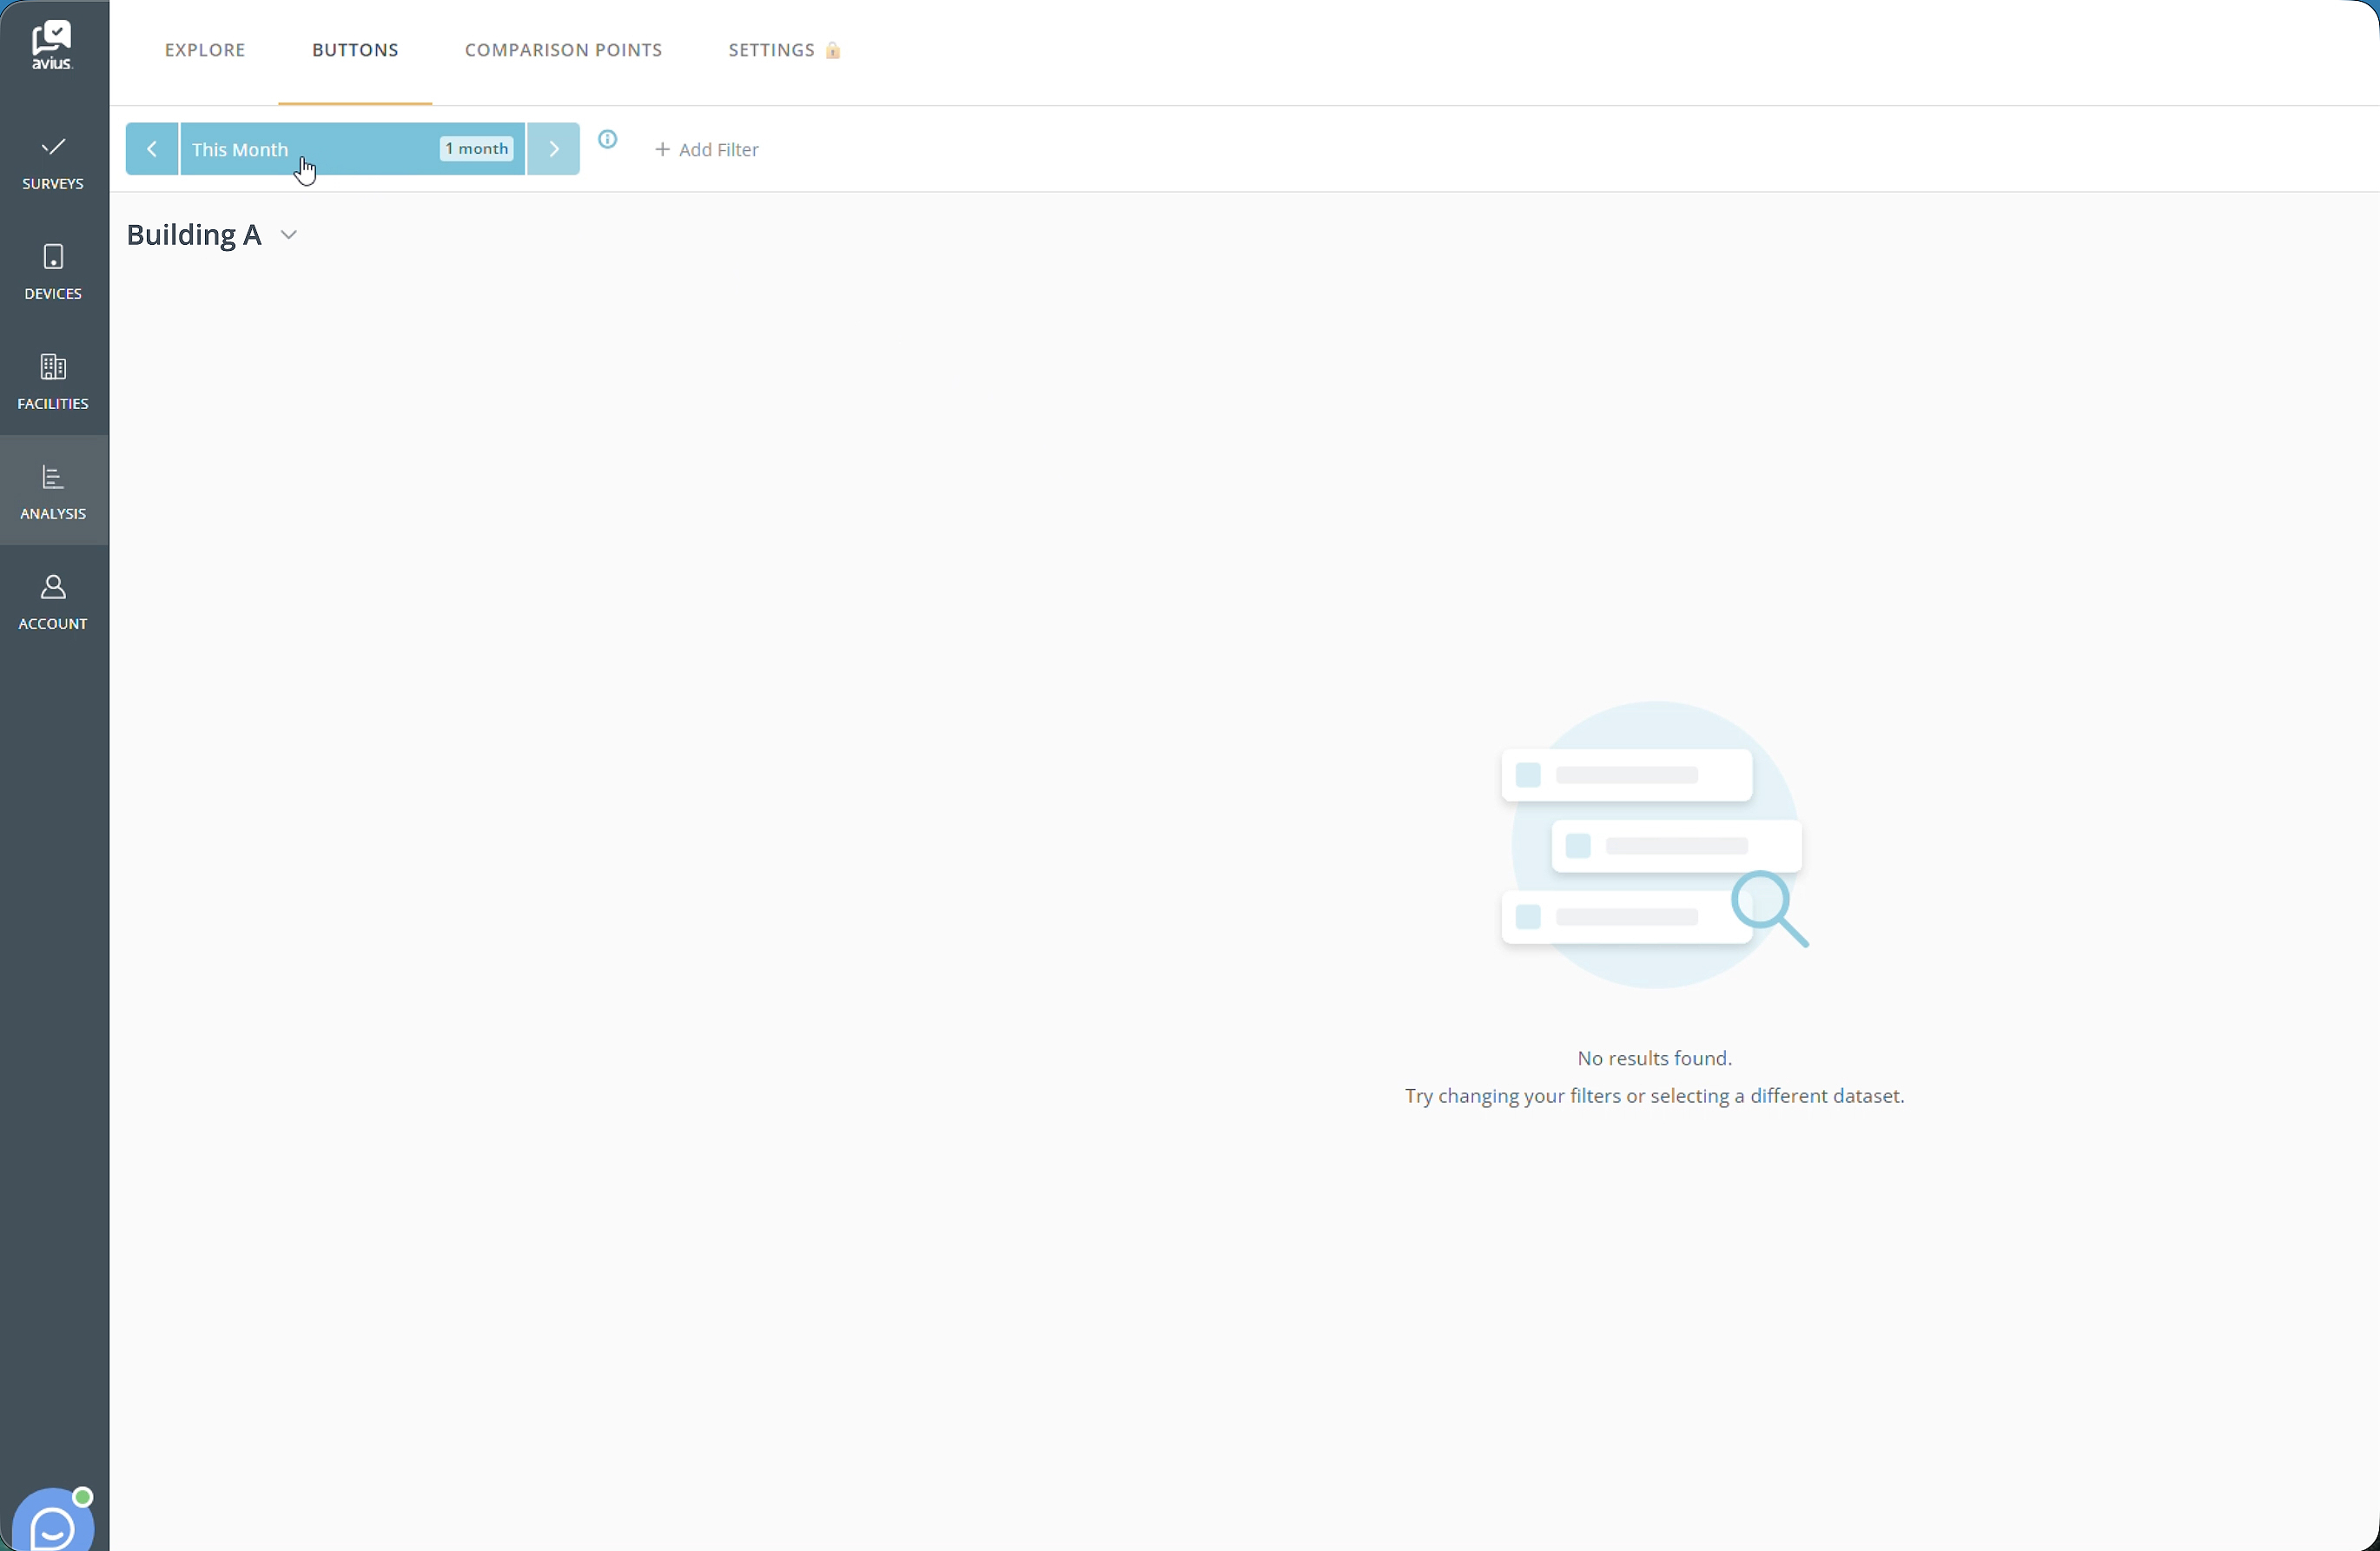
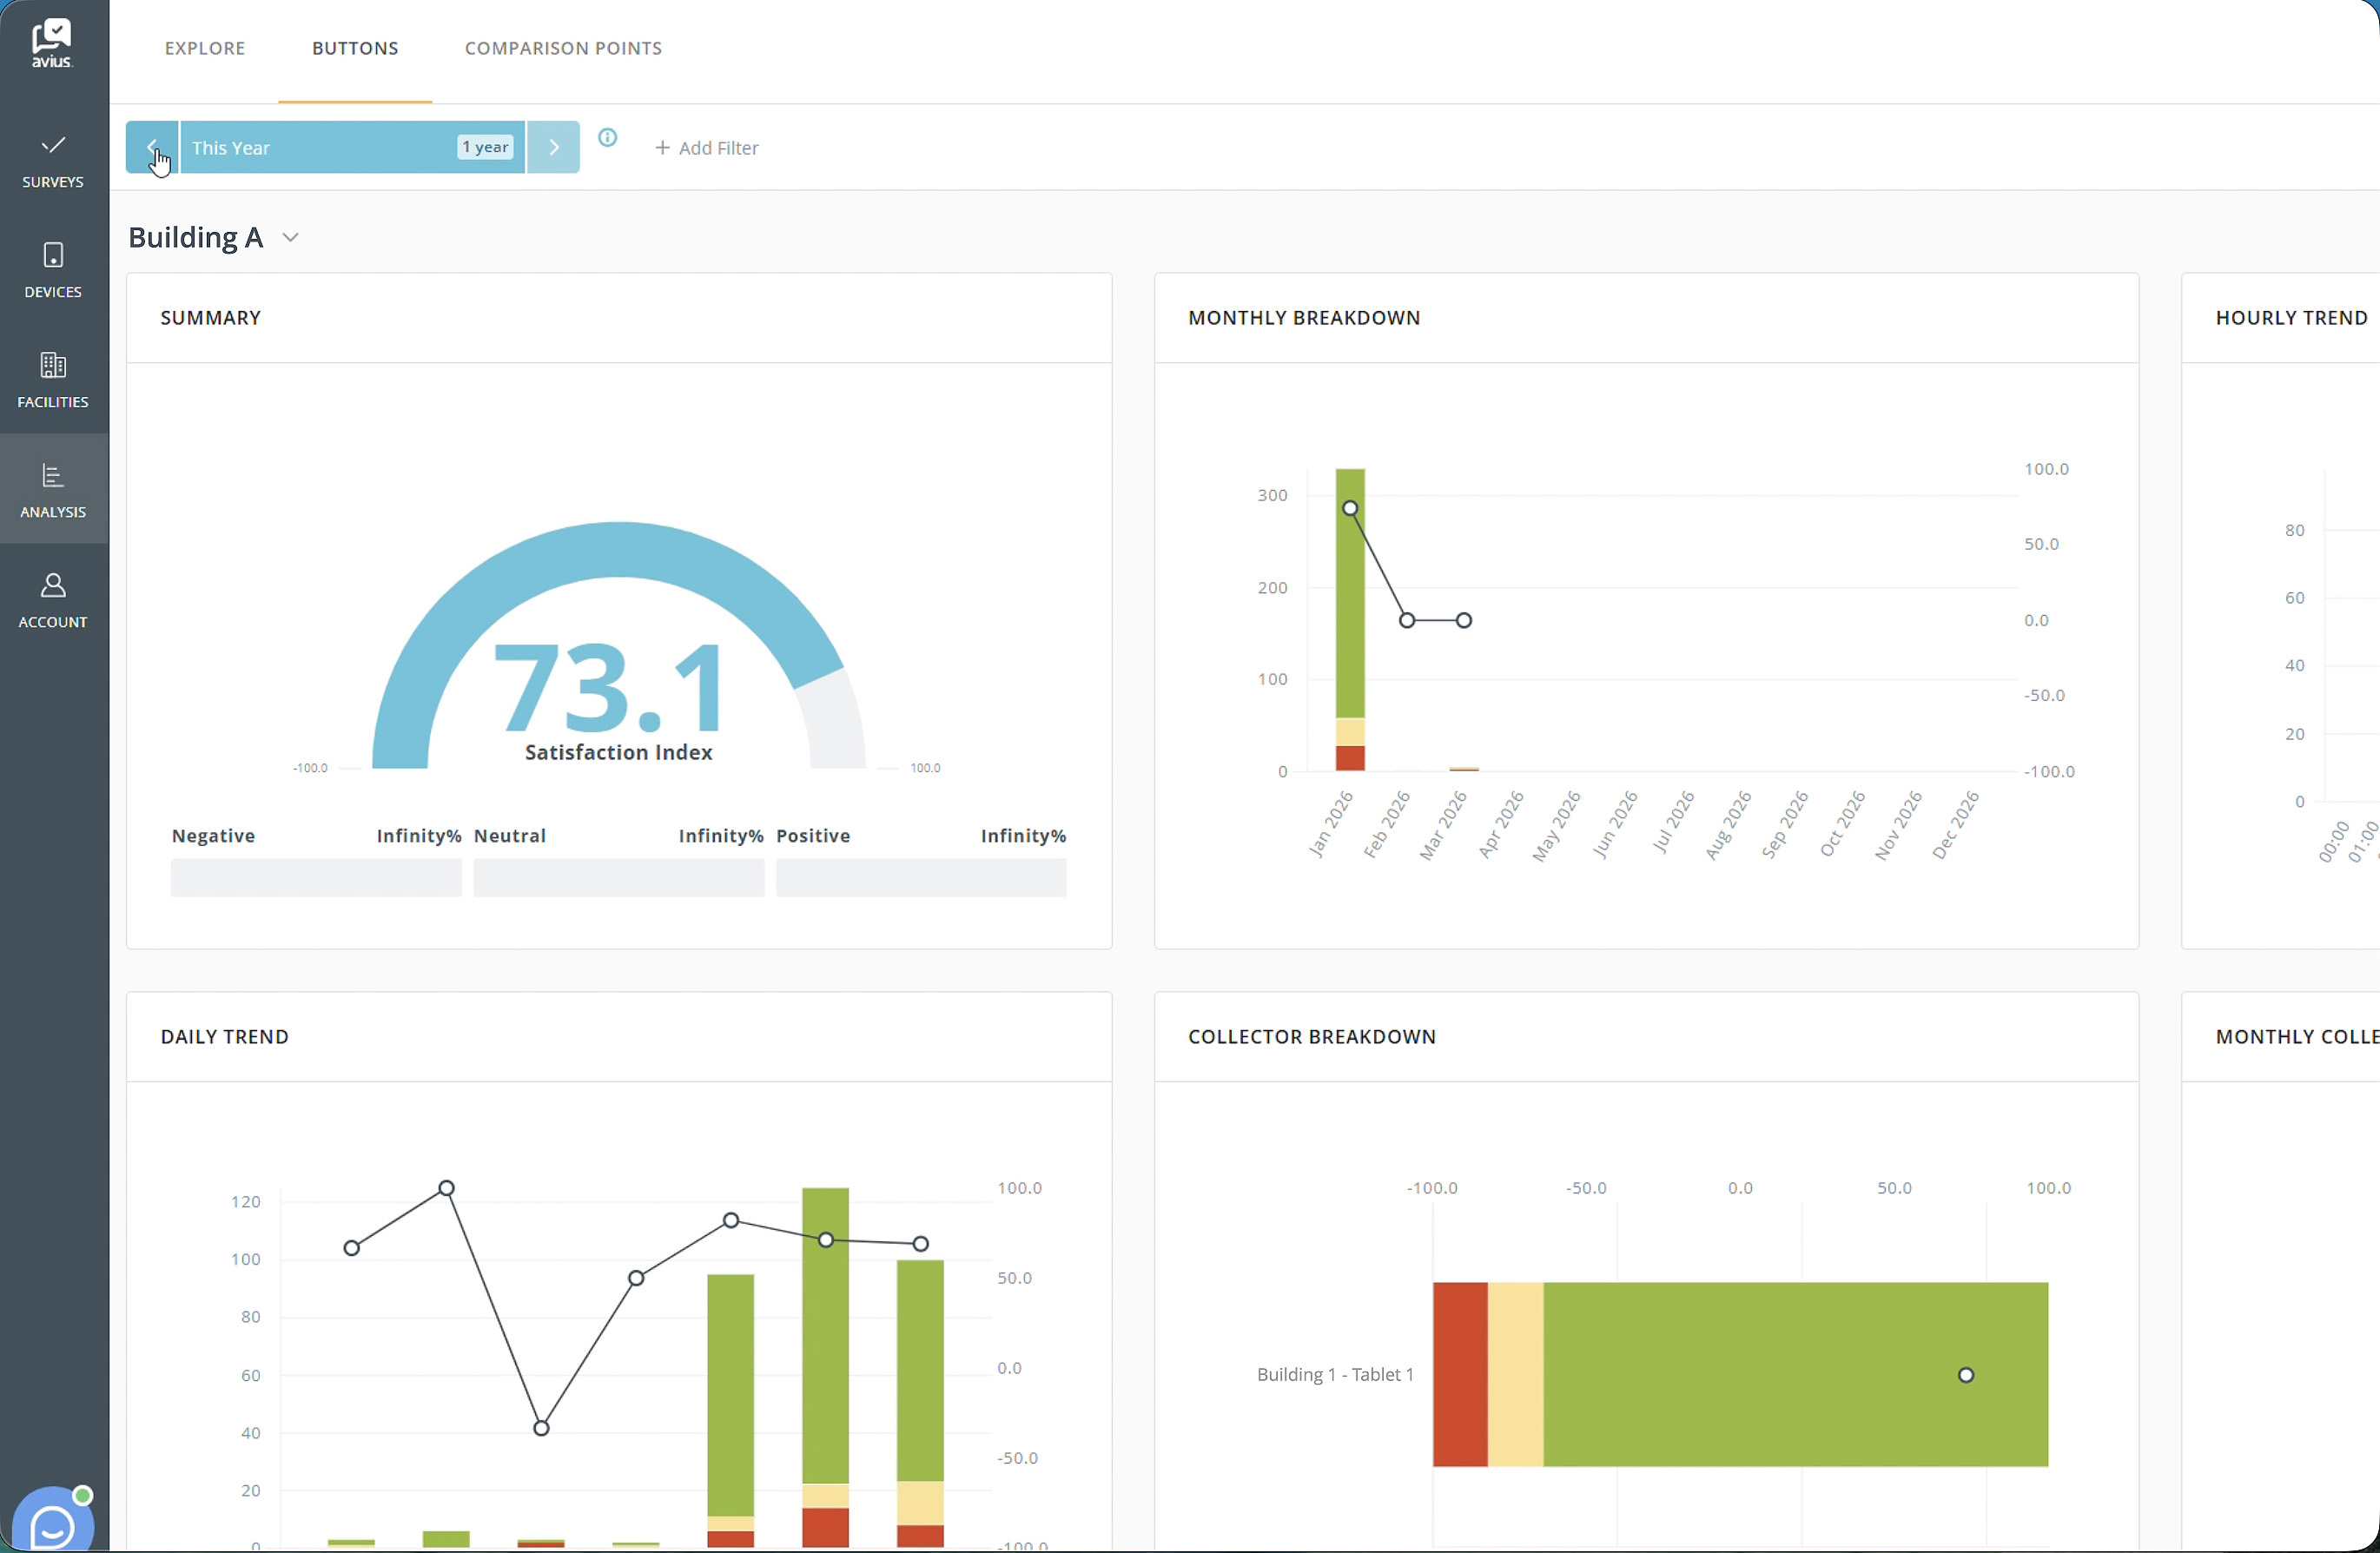
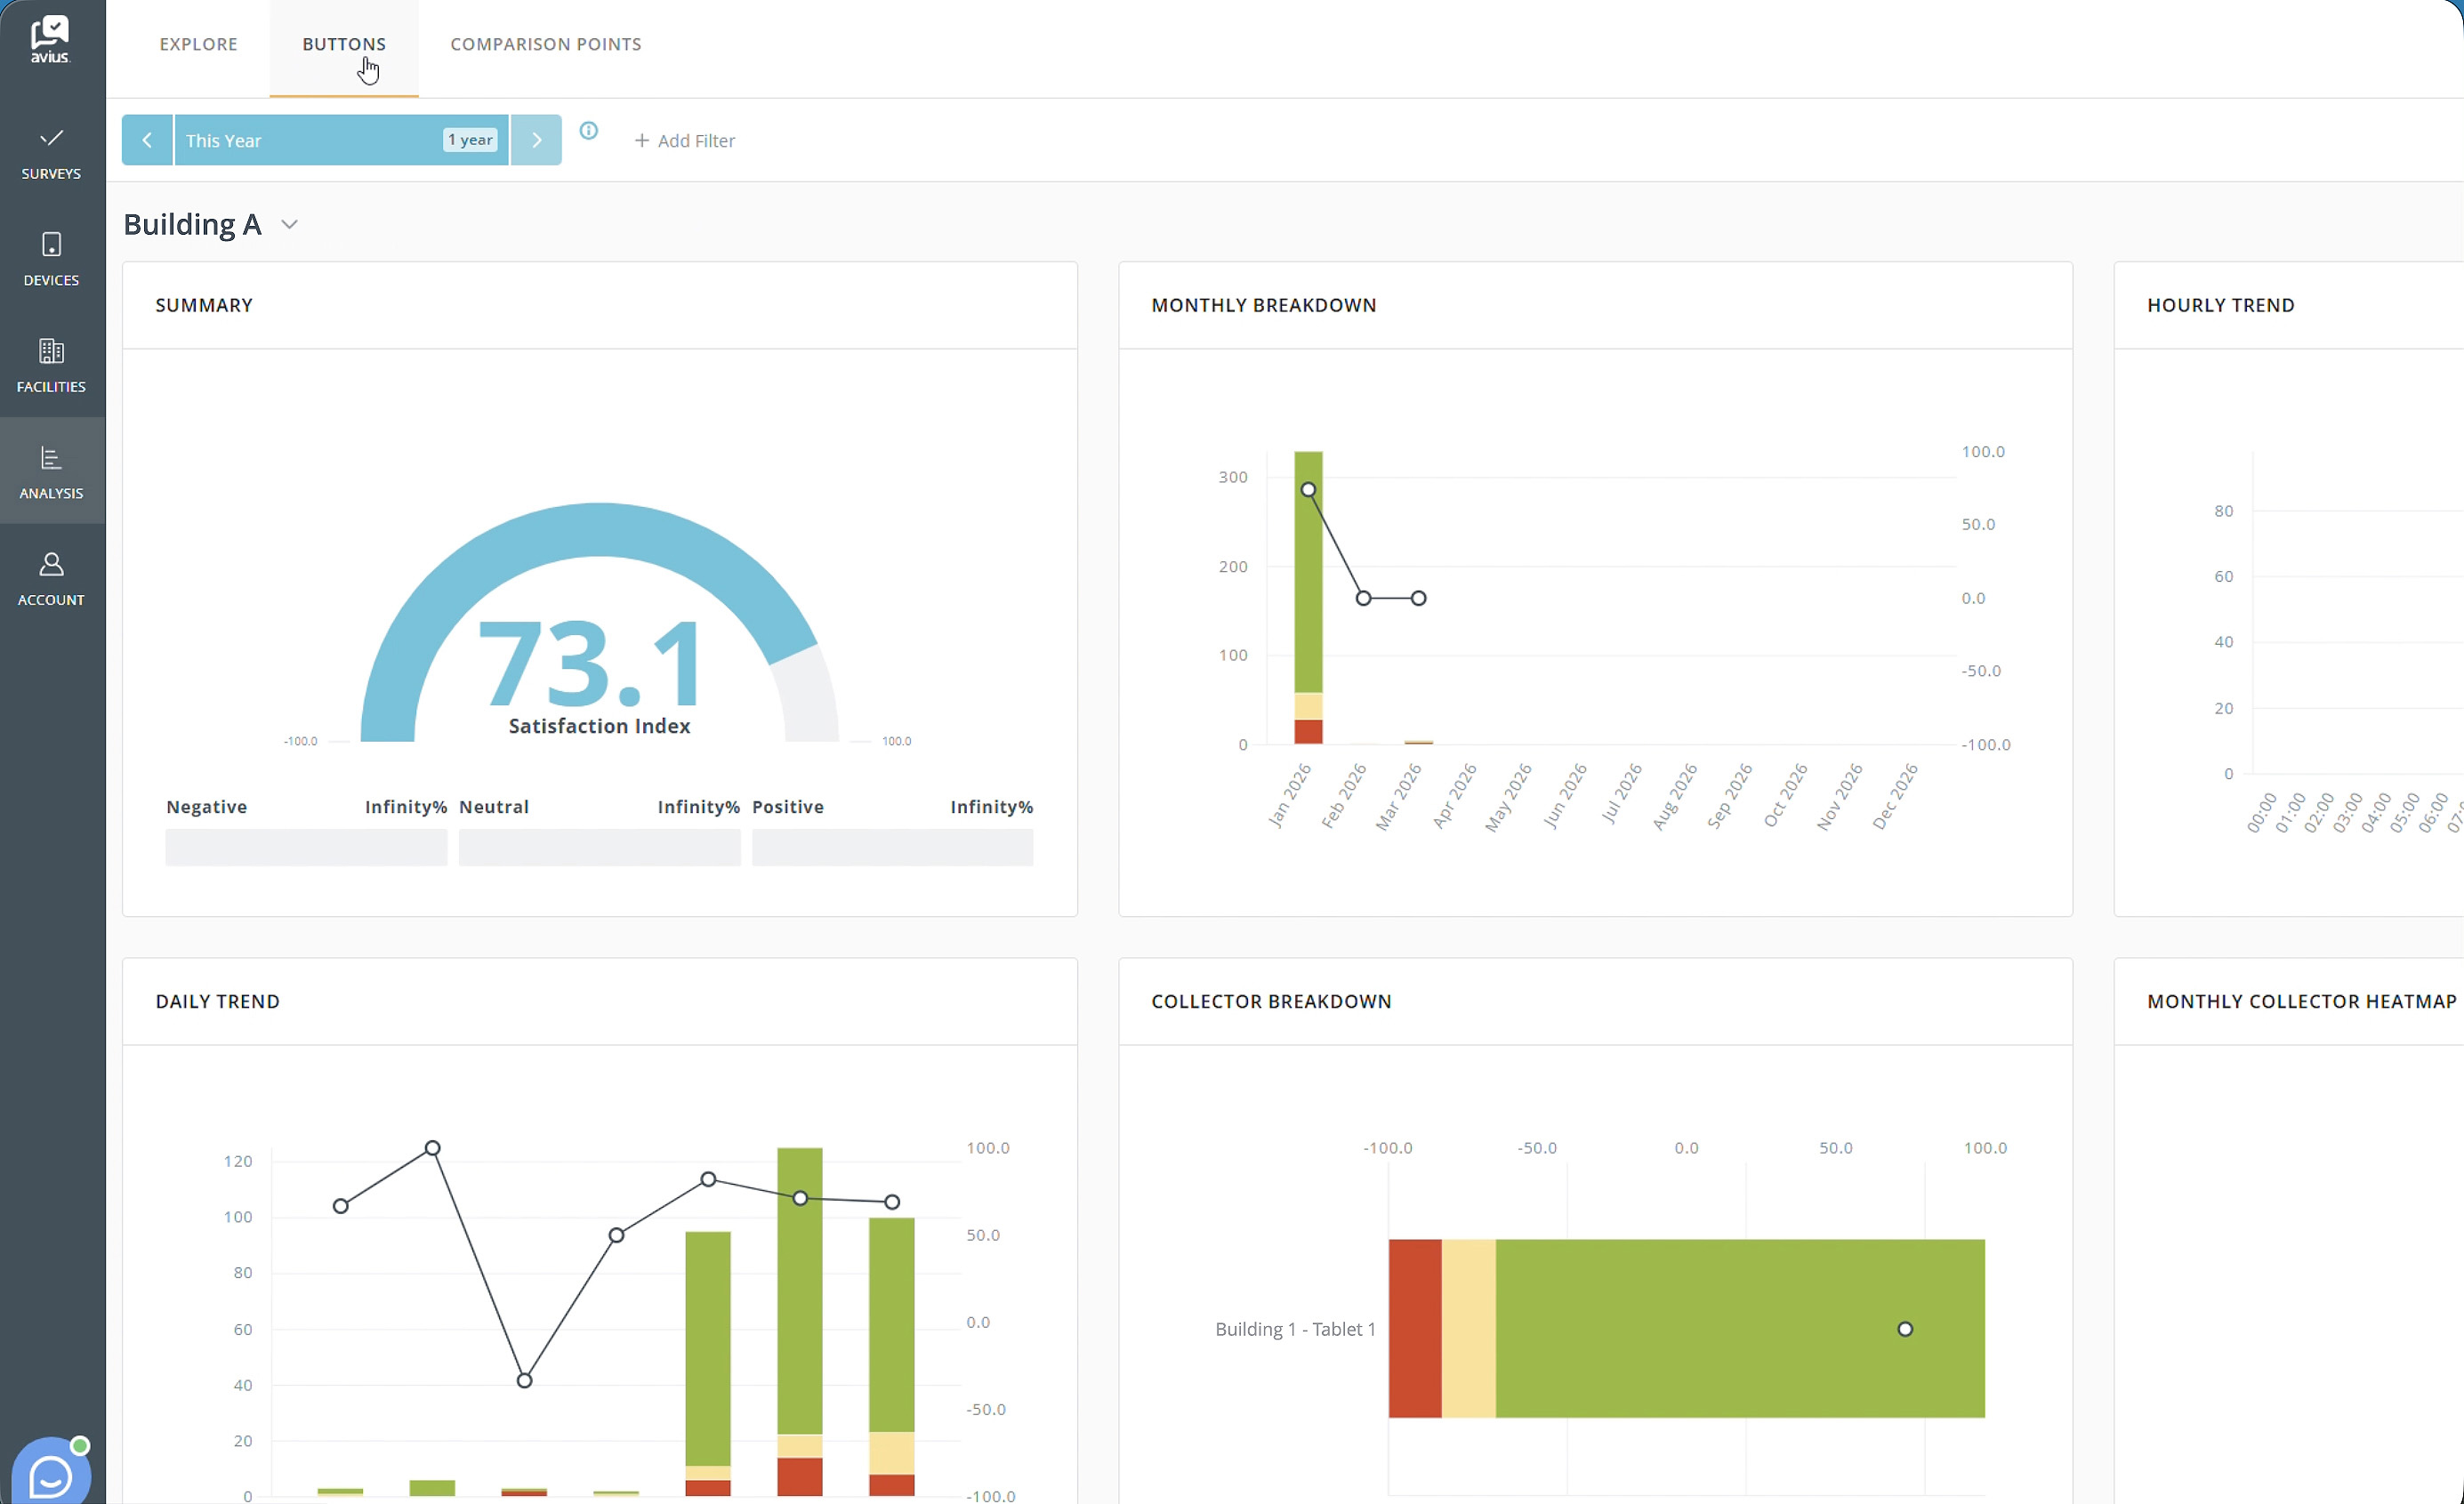
BUTTONS, DATA AND FILTERS
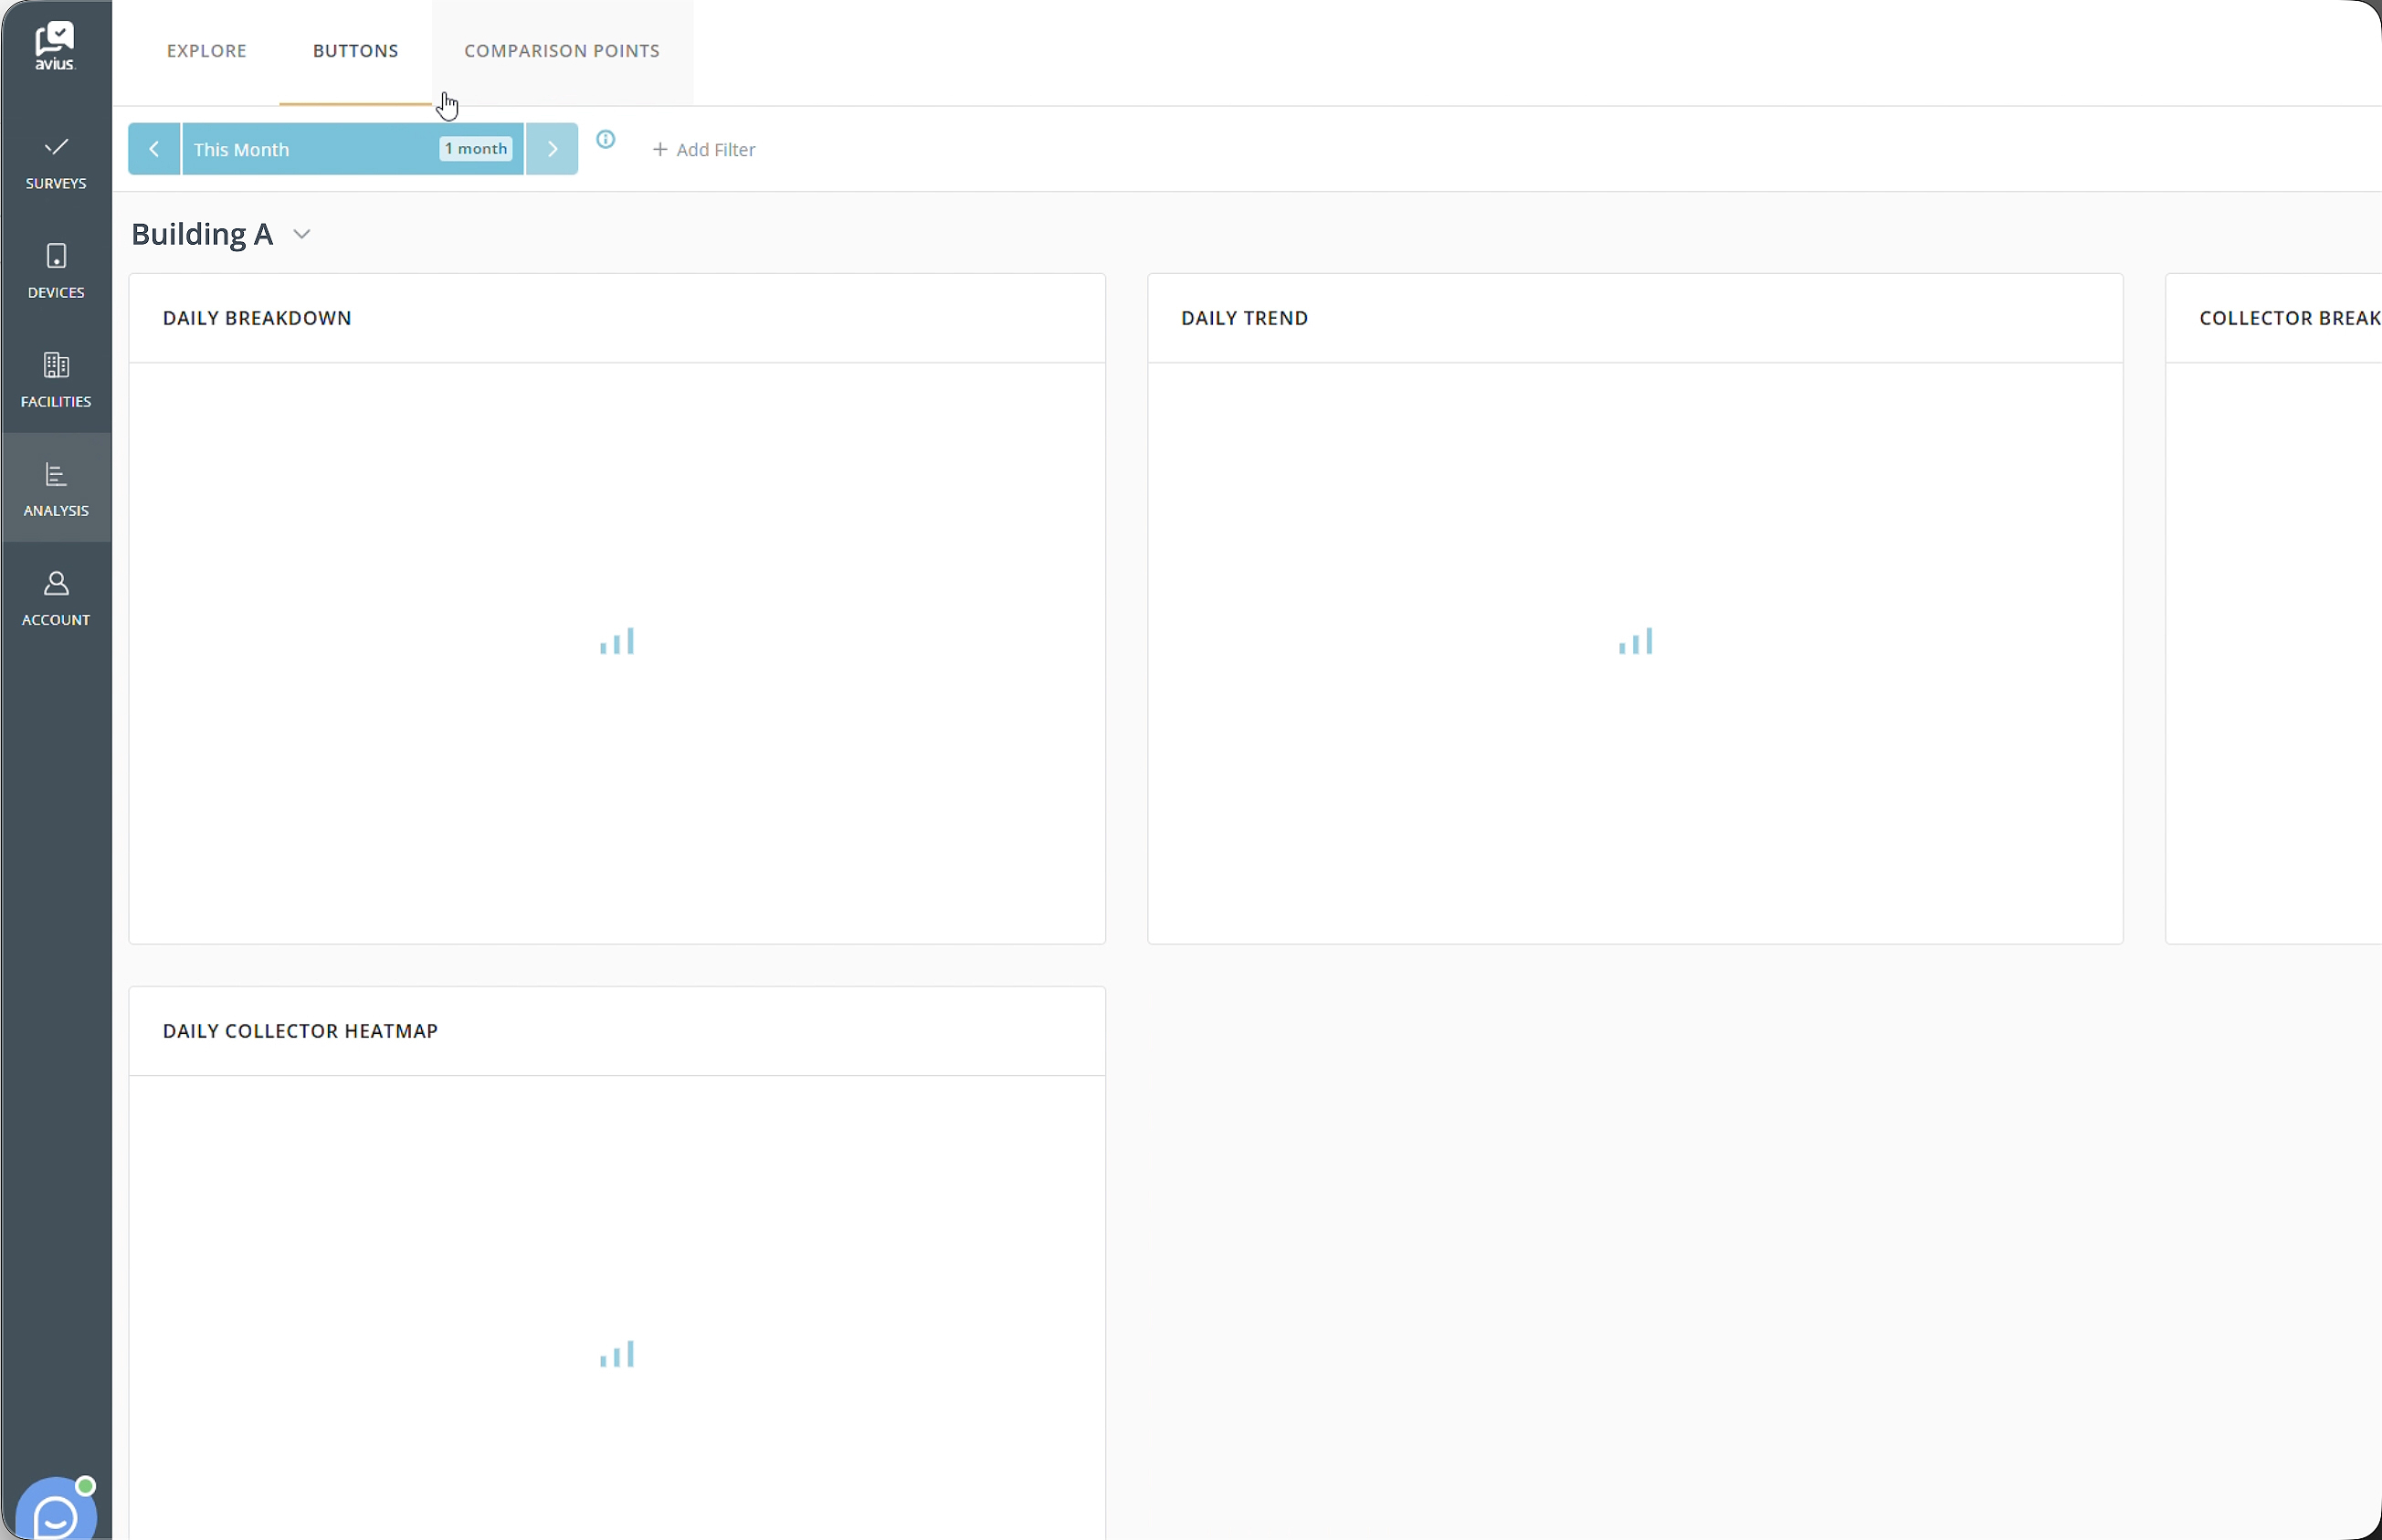
To view Buttons data, click the Buttons tab at the top of the Analysis page.
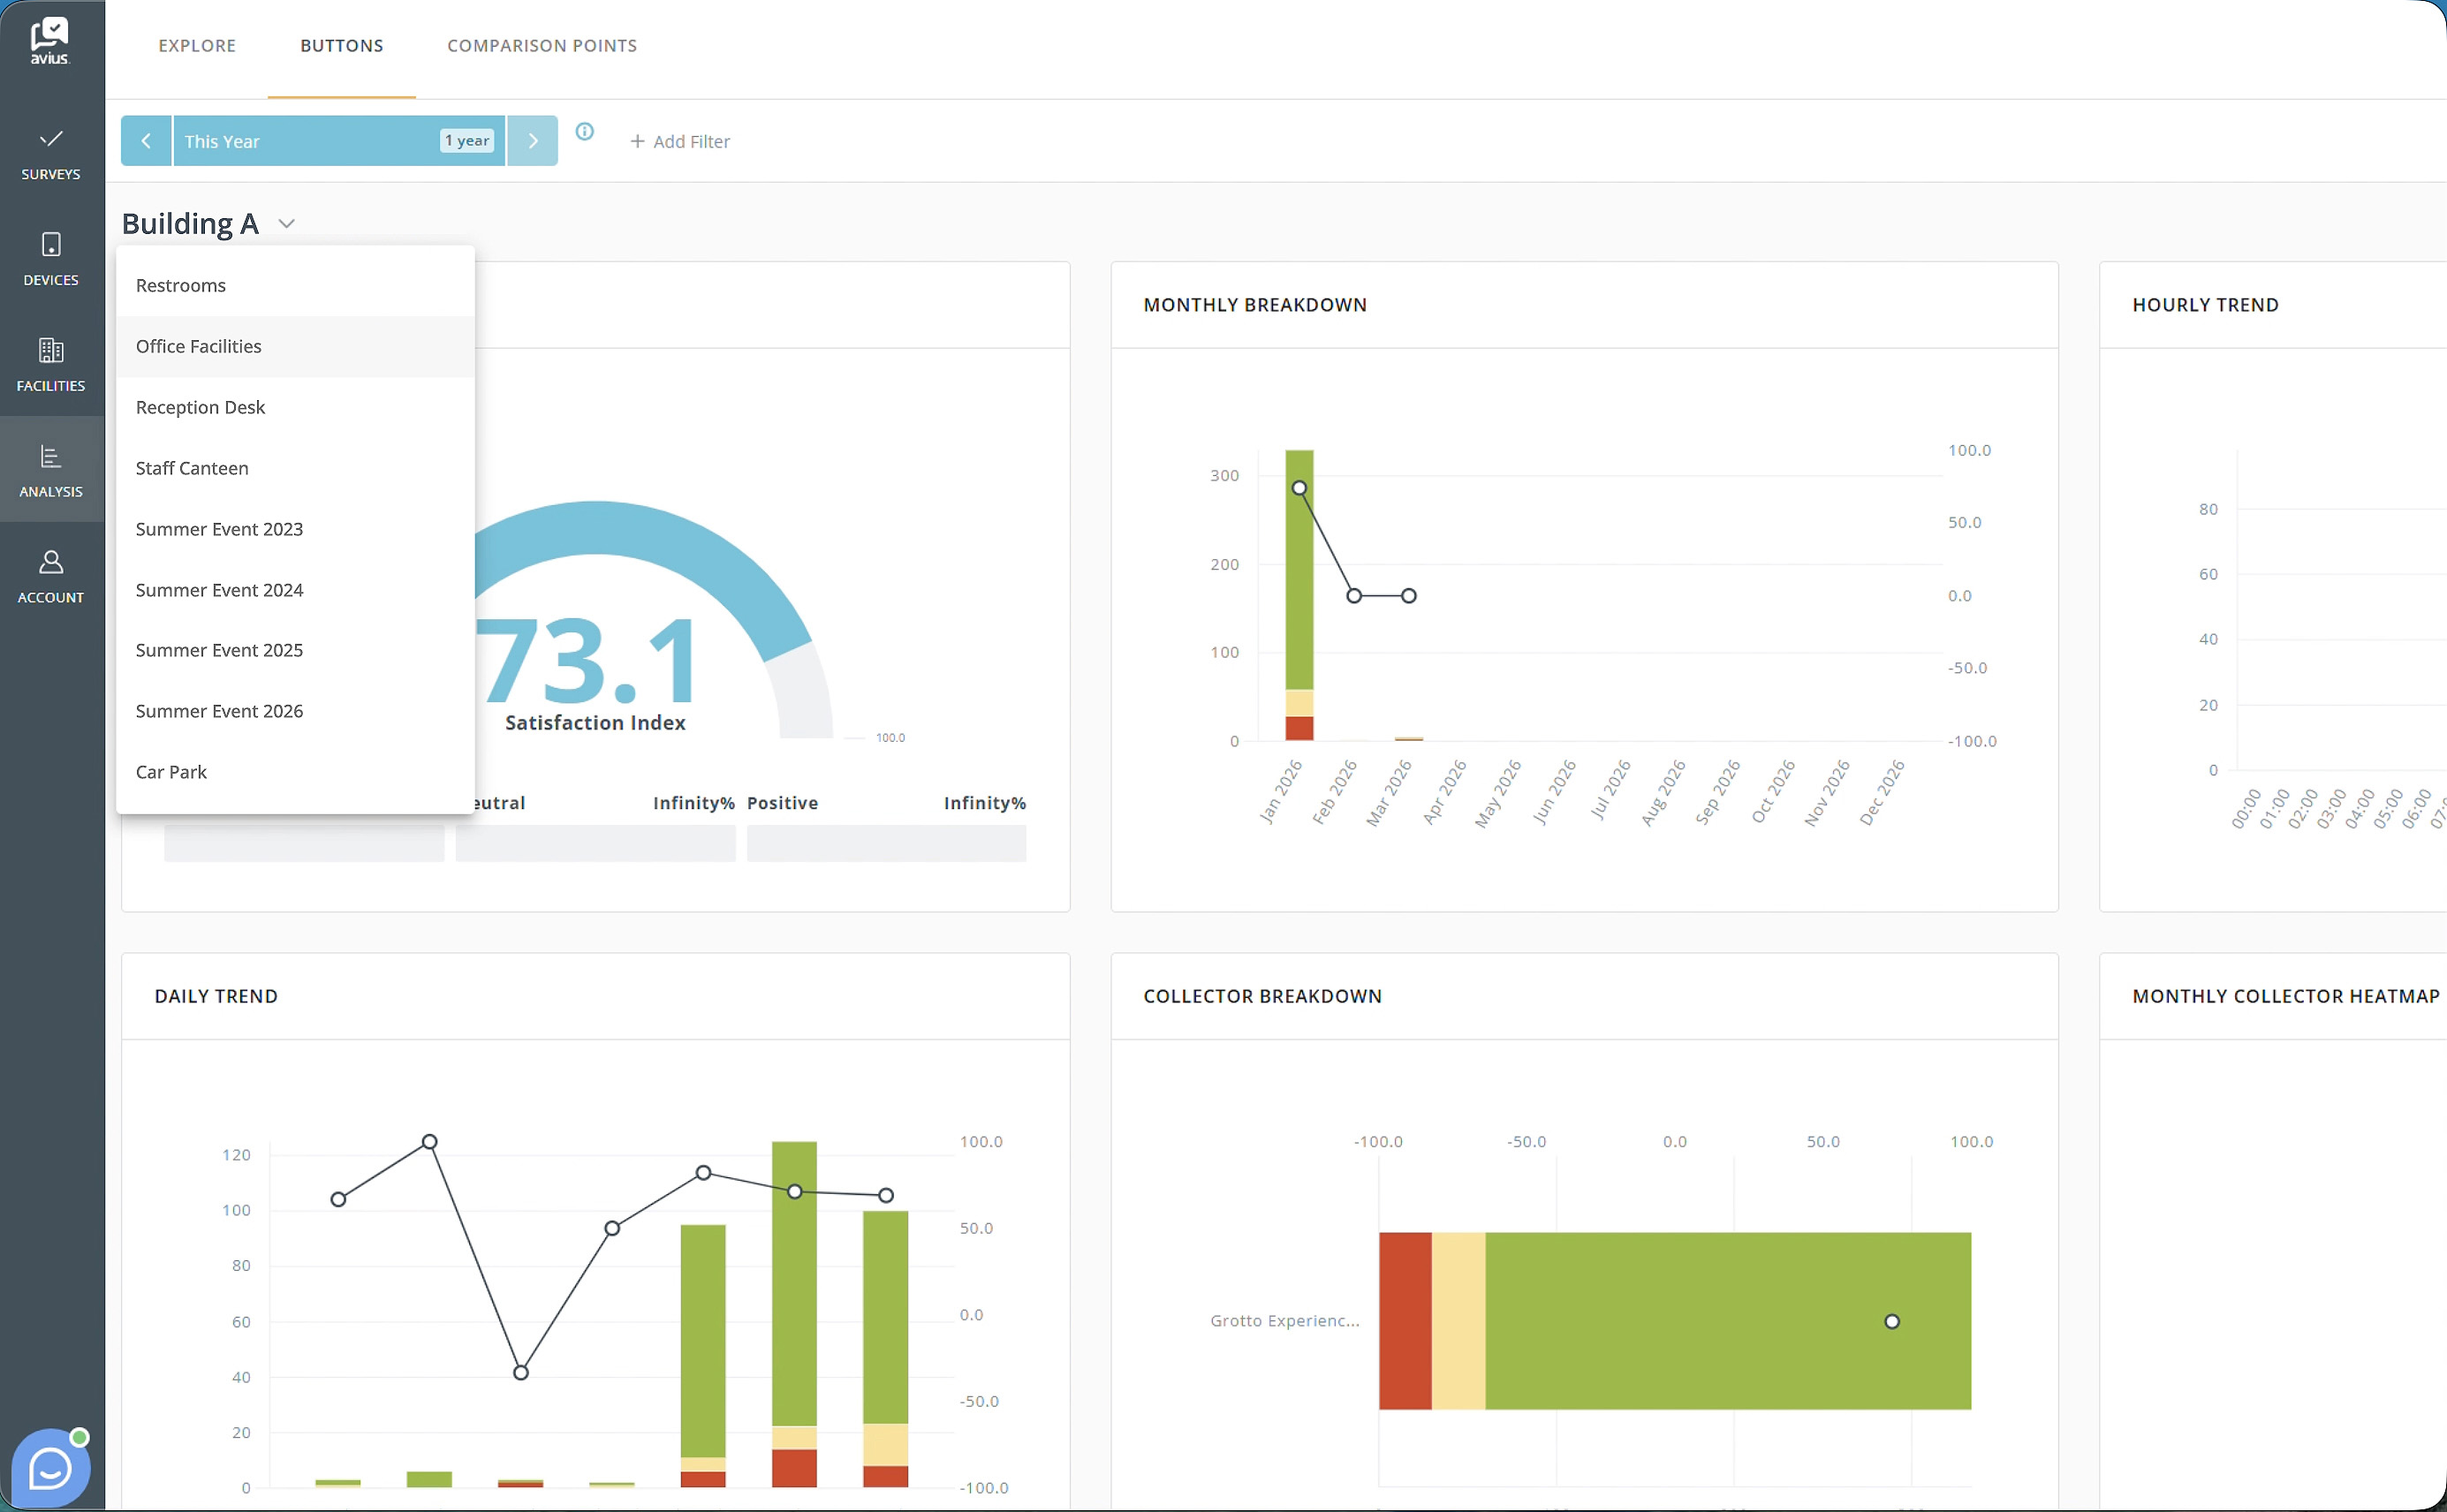
The page will display data for your default button set. To switch to a different button set, click the dropdown arrow next to the button set name and select the set you want to view.
You can also filter the data by clicking Add Filter next to the date filter. Available filters include Location and Response Method.
Click for more detail
Click for more detail
HOUR OF DAY BREAKDOWN
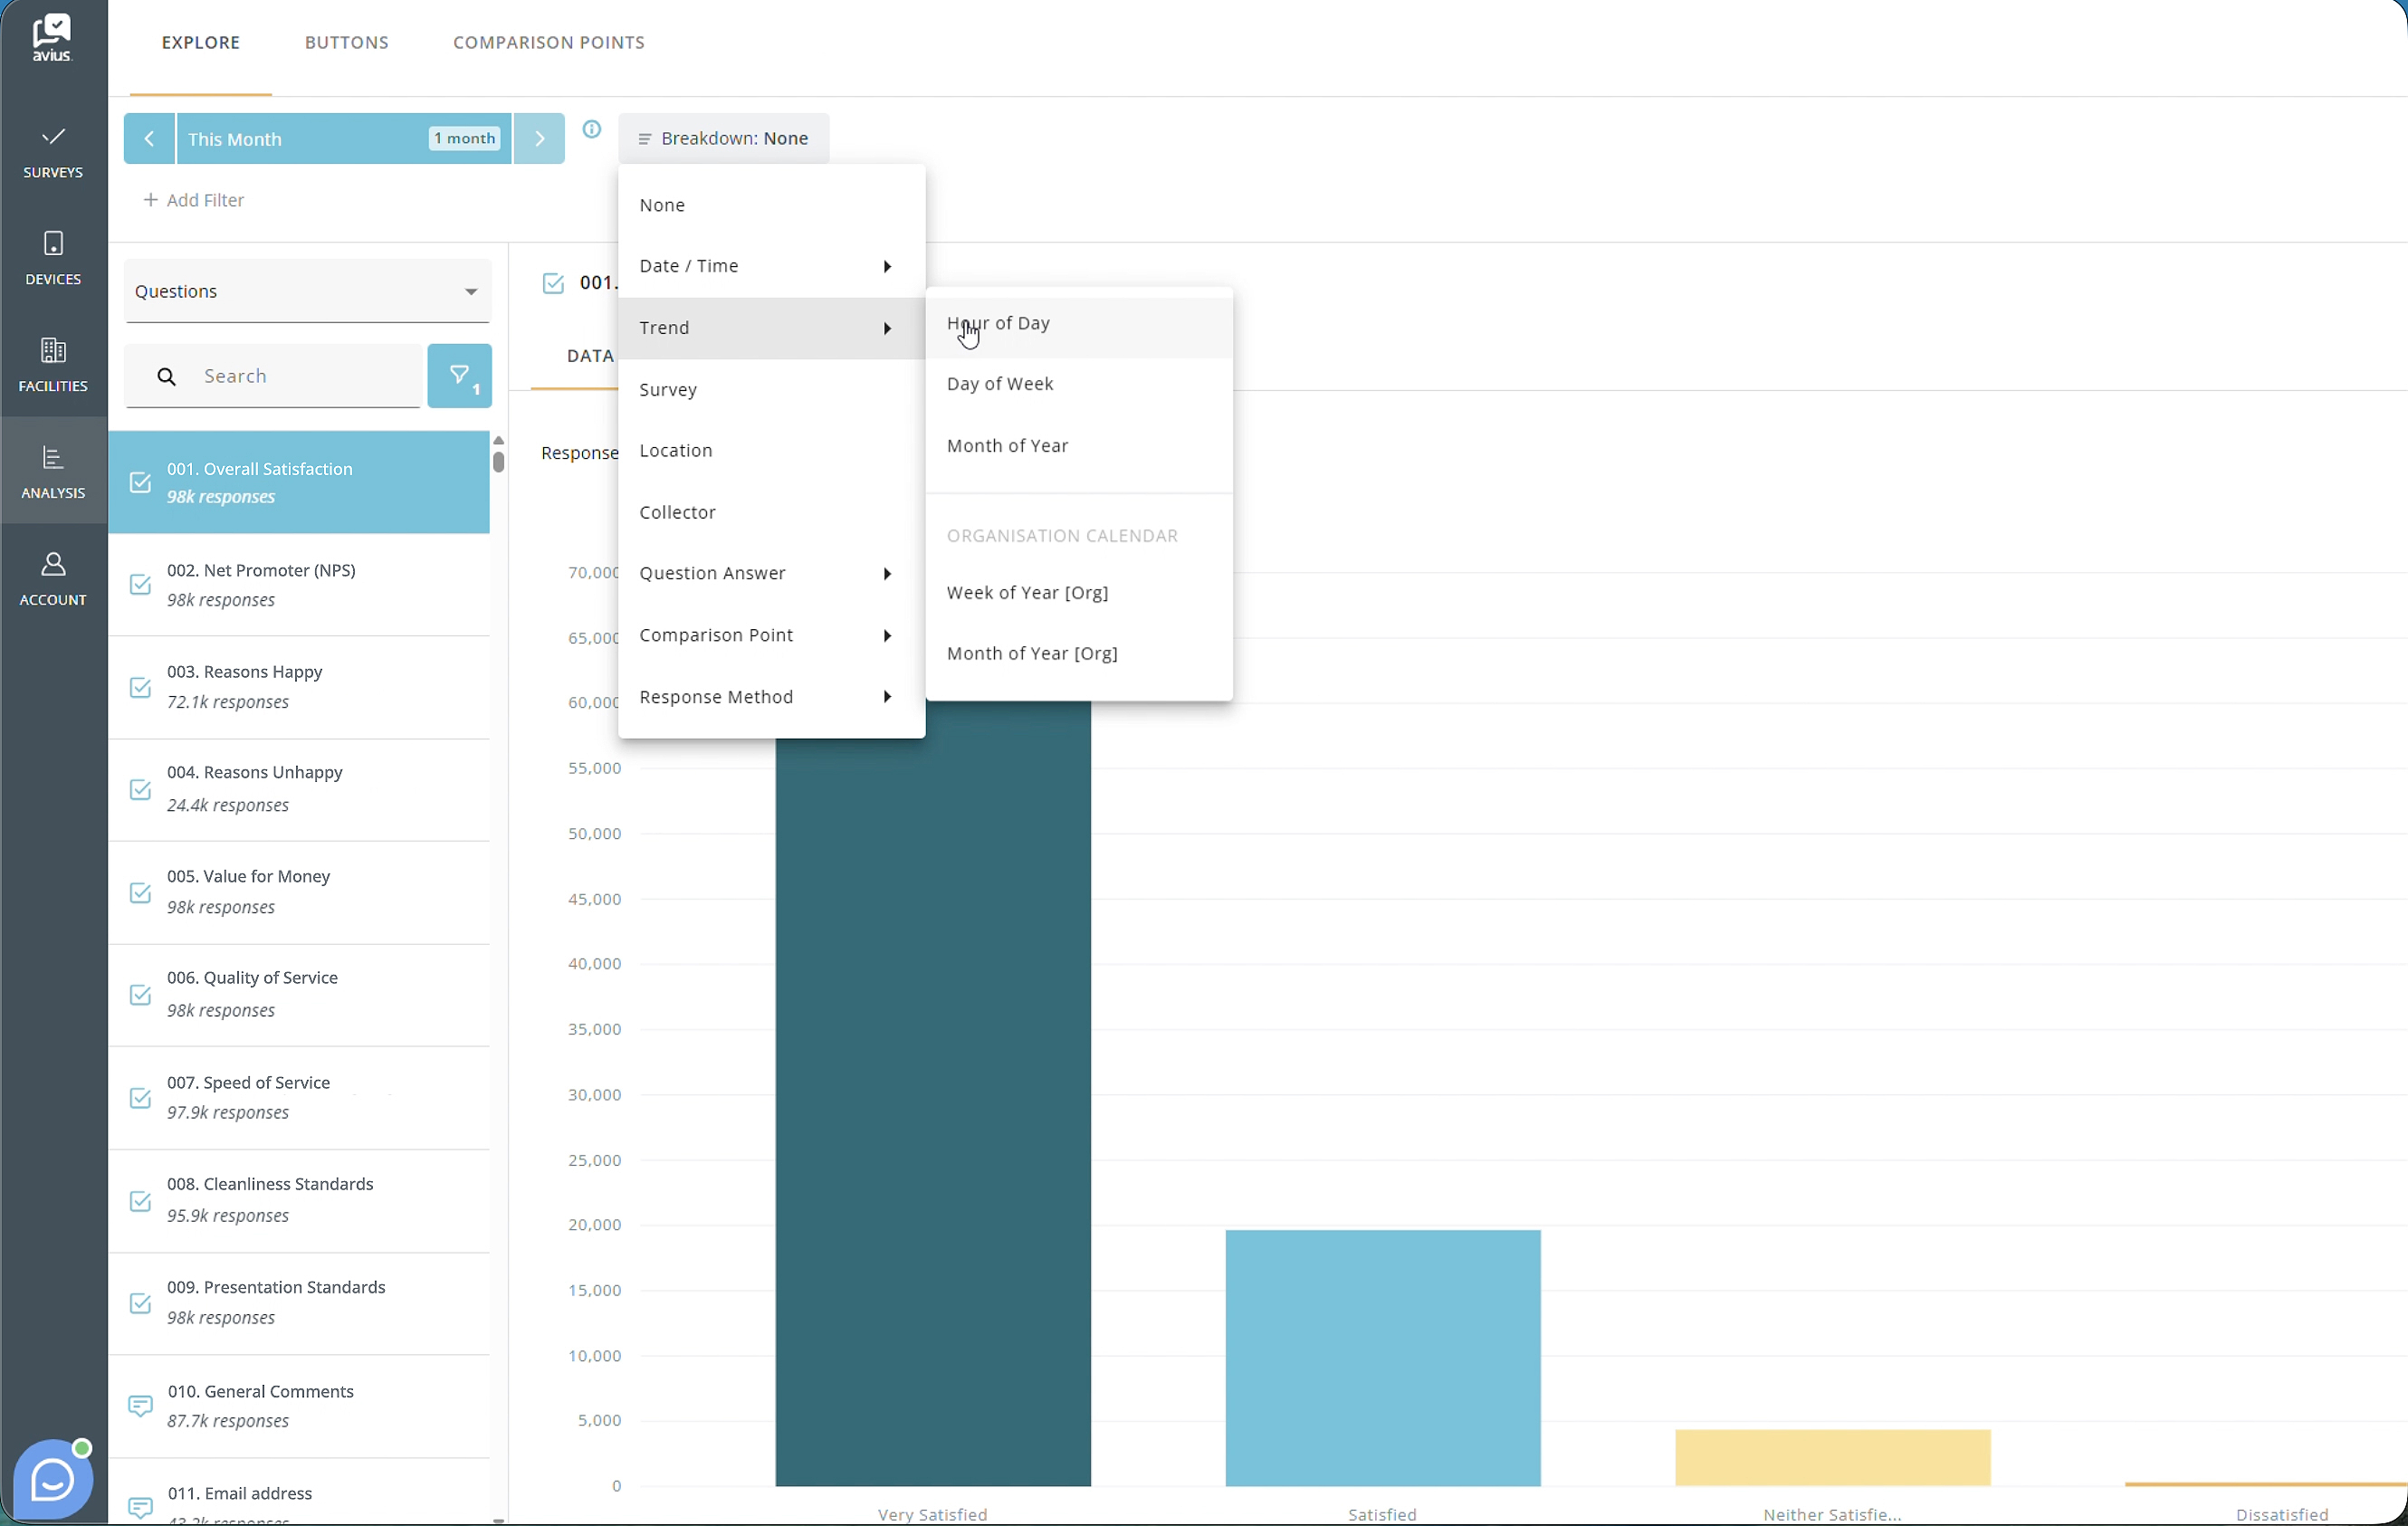
To view how responses vary throughout the day, click the Breakdown dropdown next to the date filter and select Hour of Day.
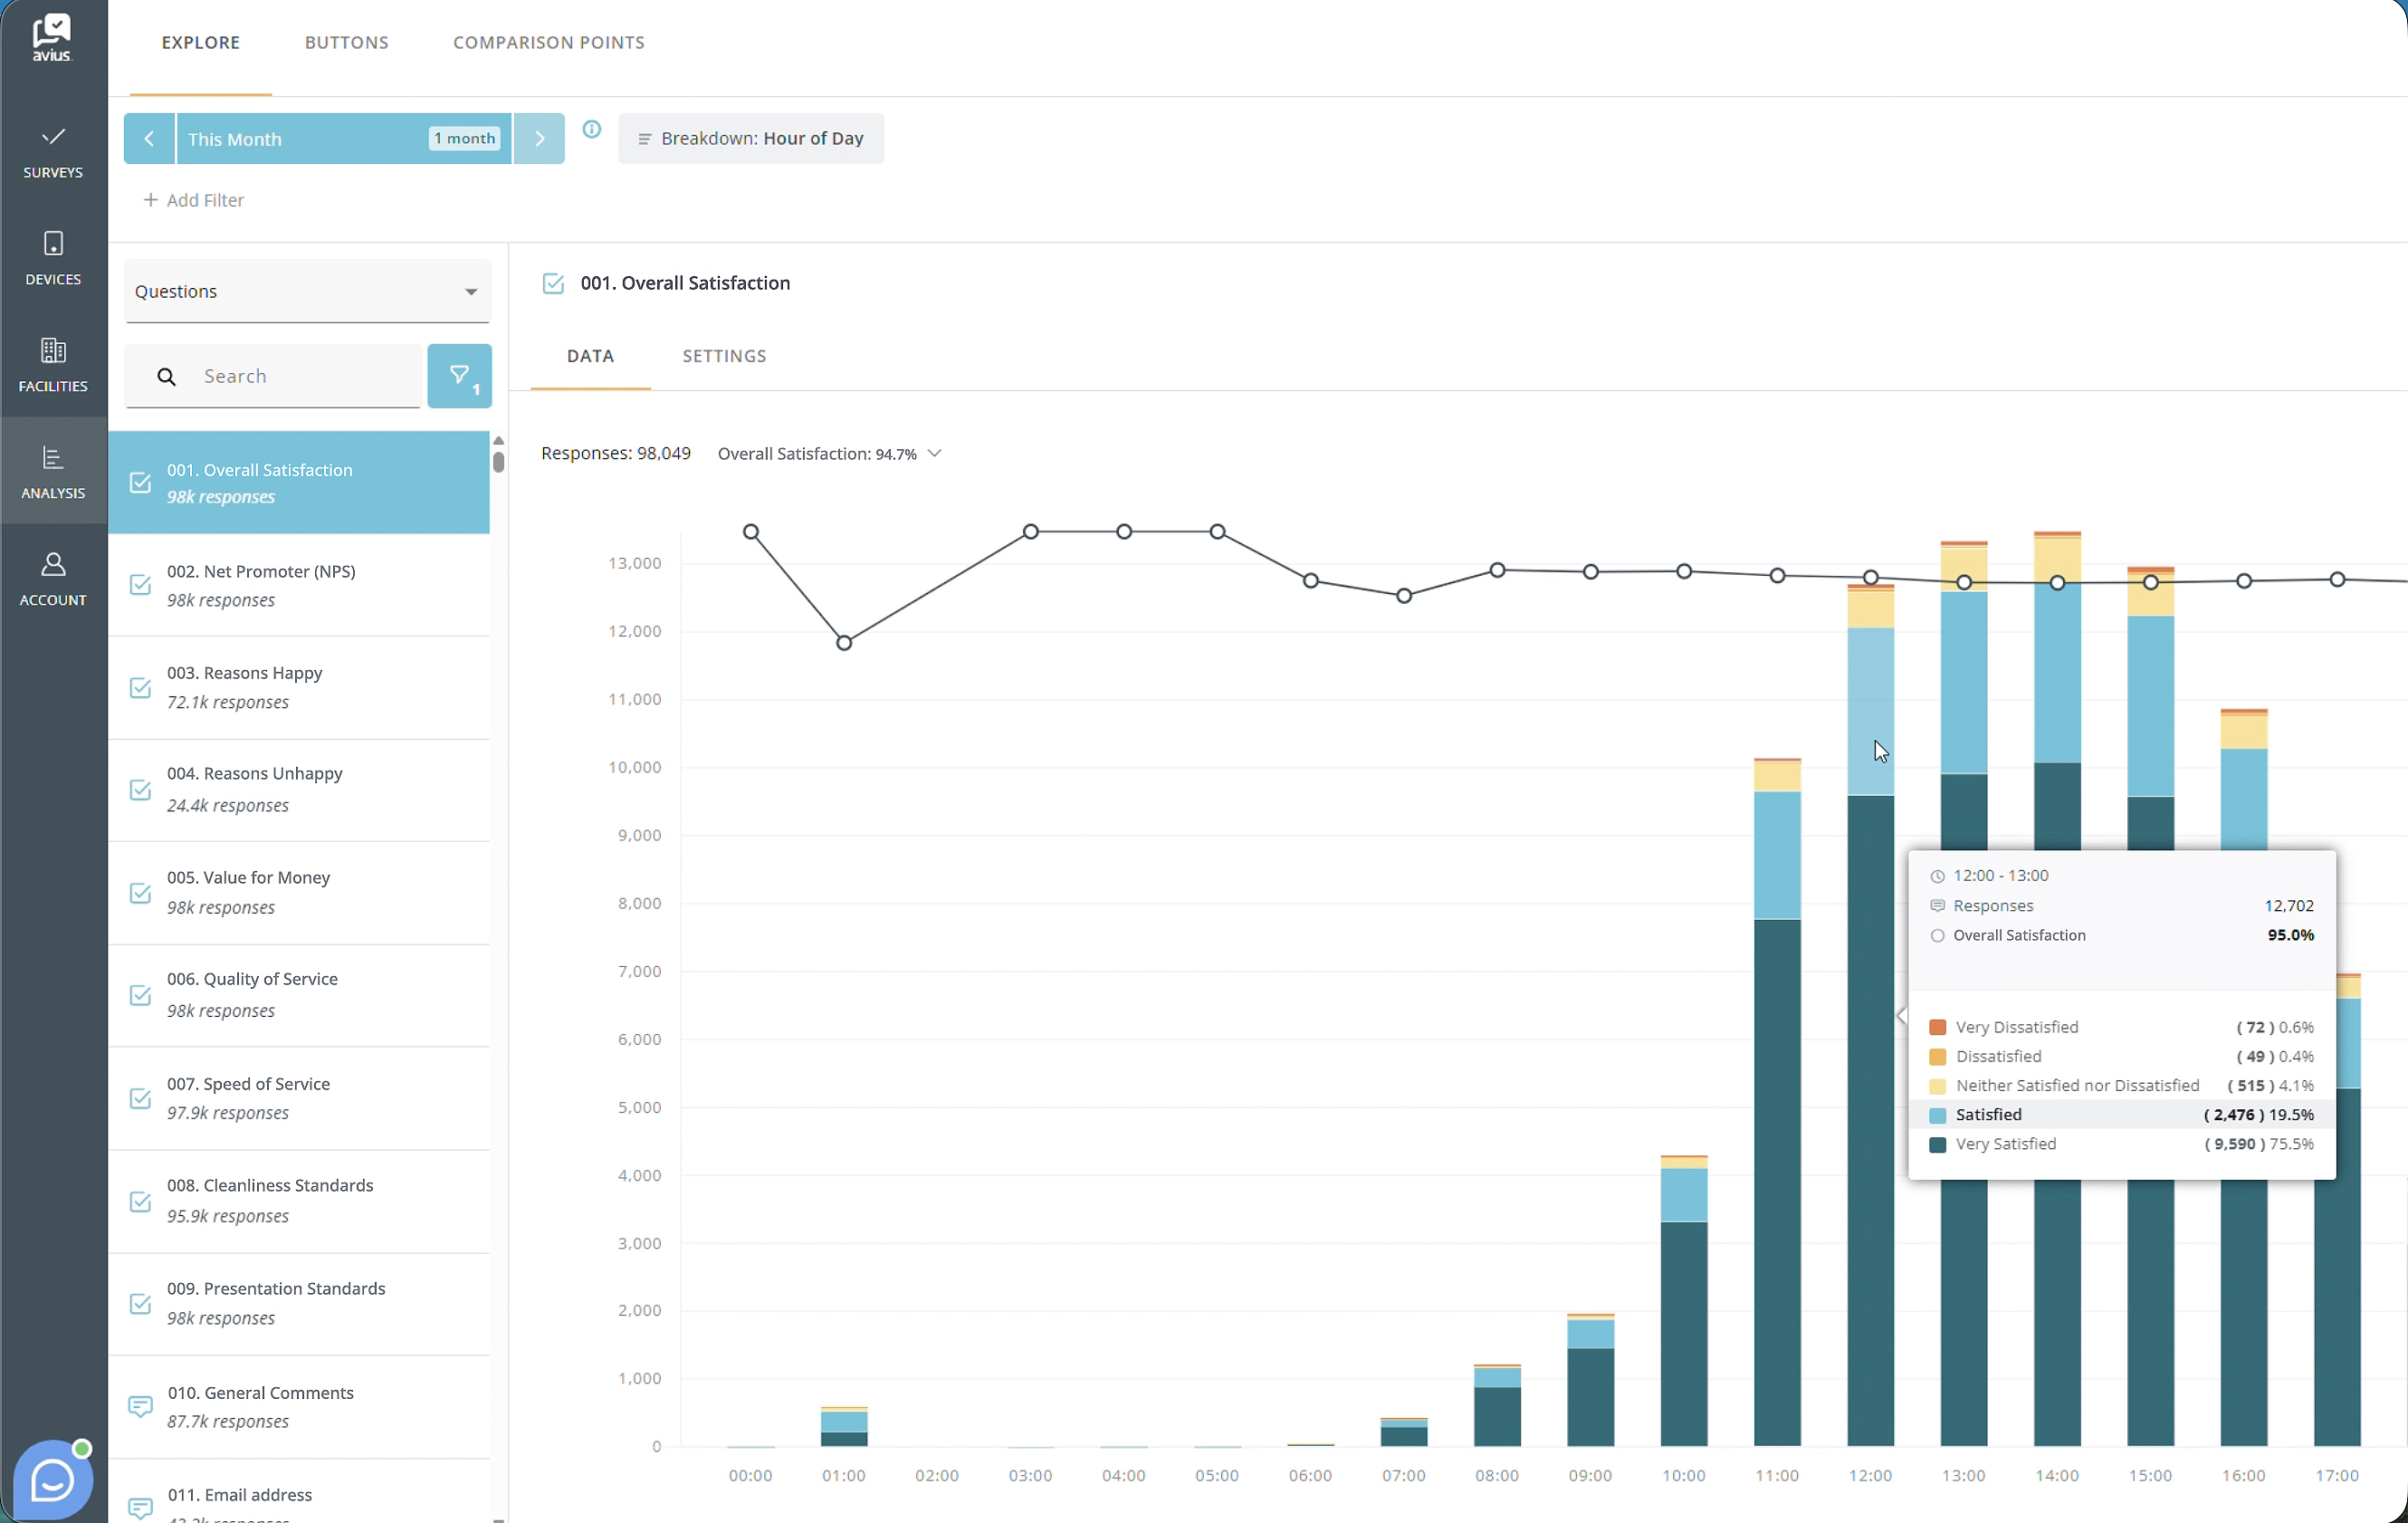
The data will be grouped by hour, helping you identify trends and response patterns at different times of the day.
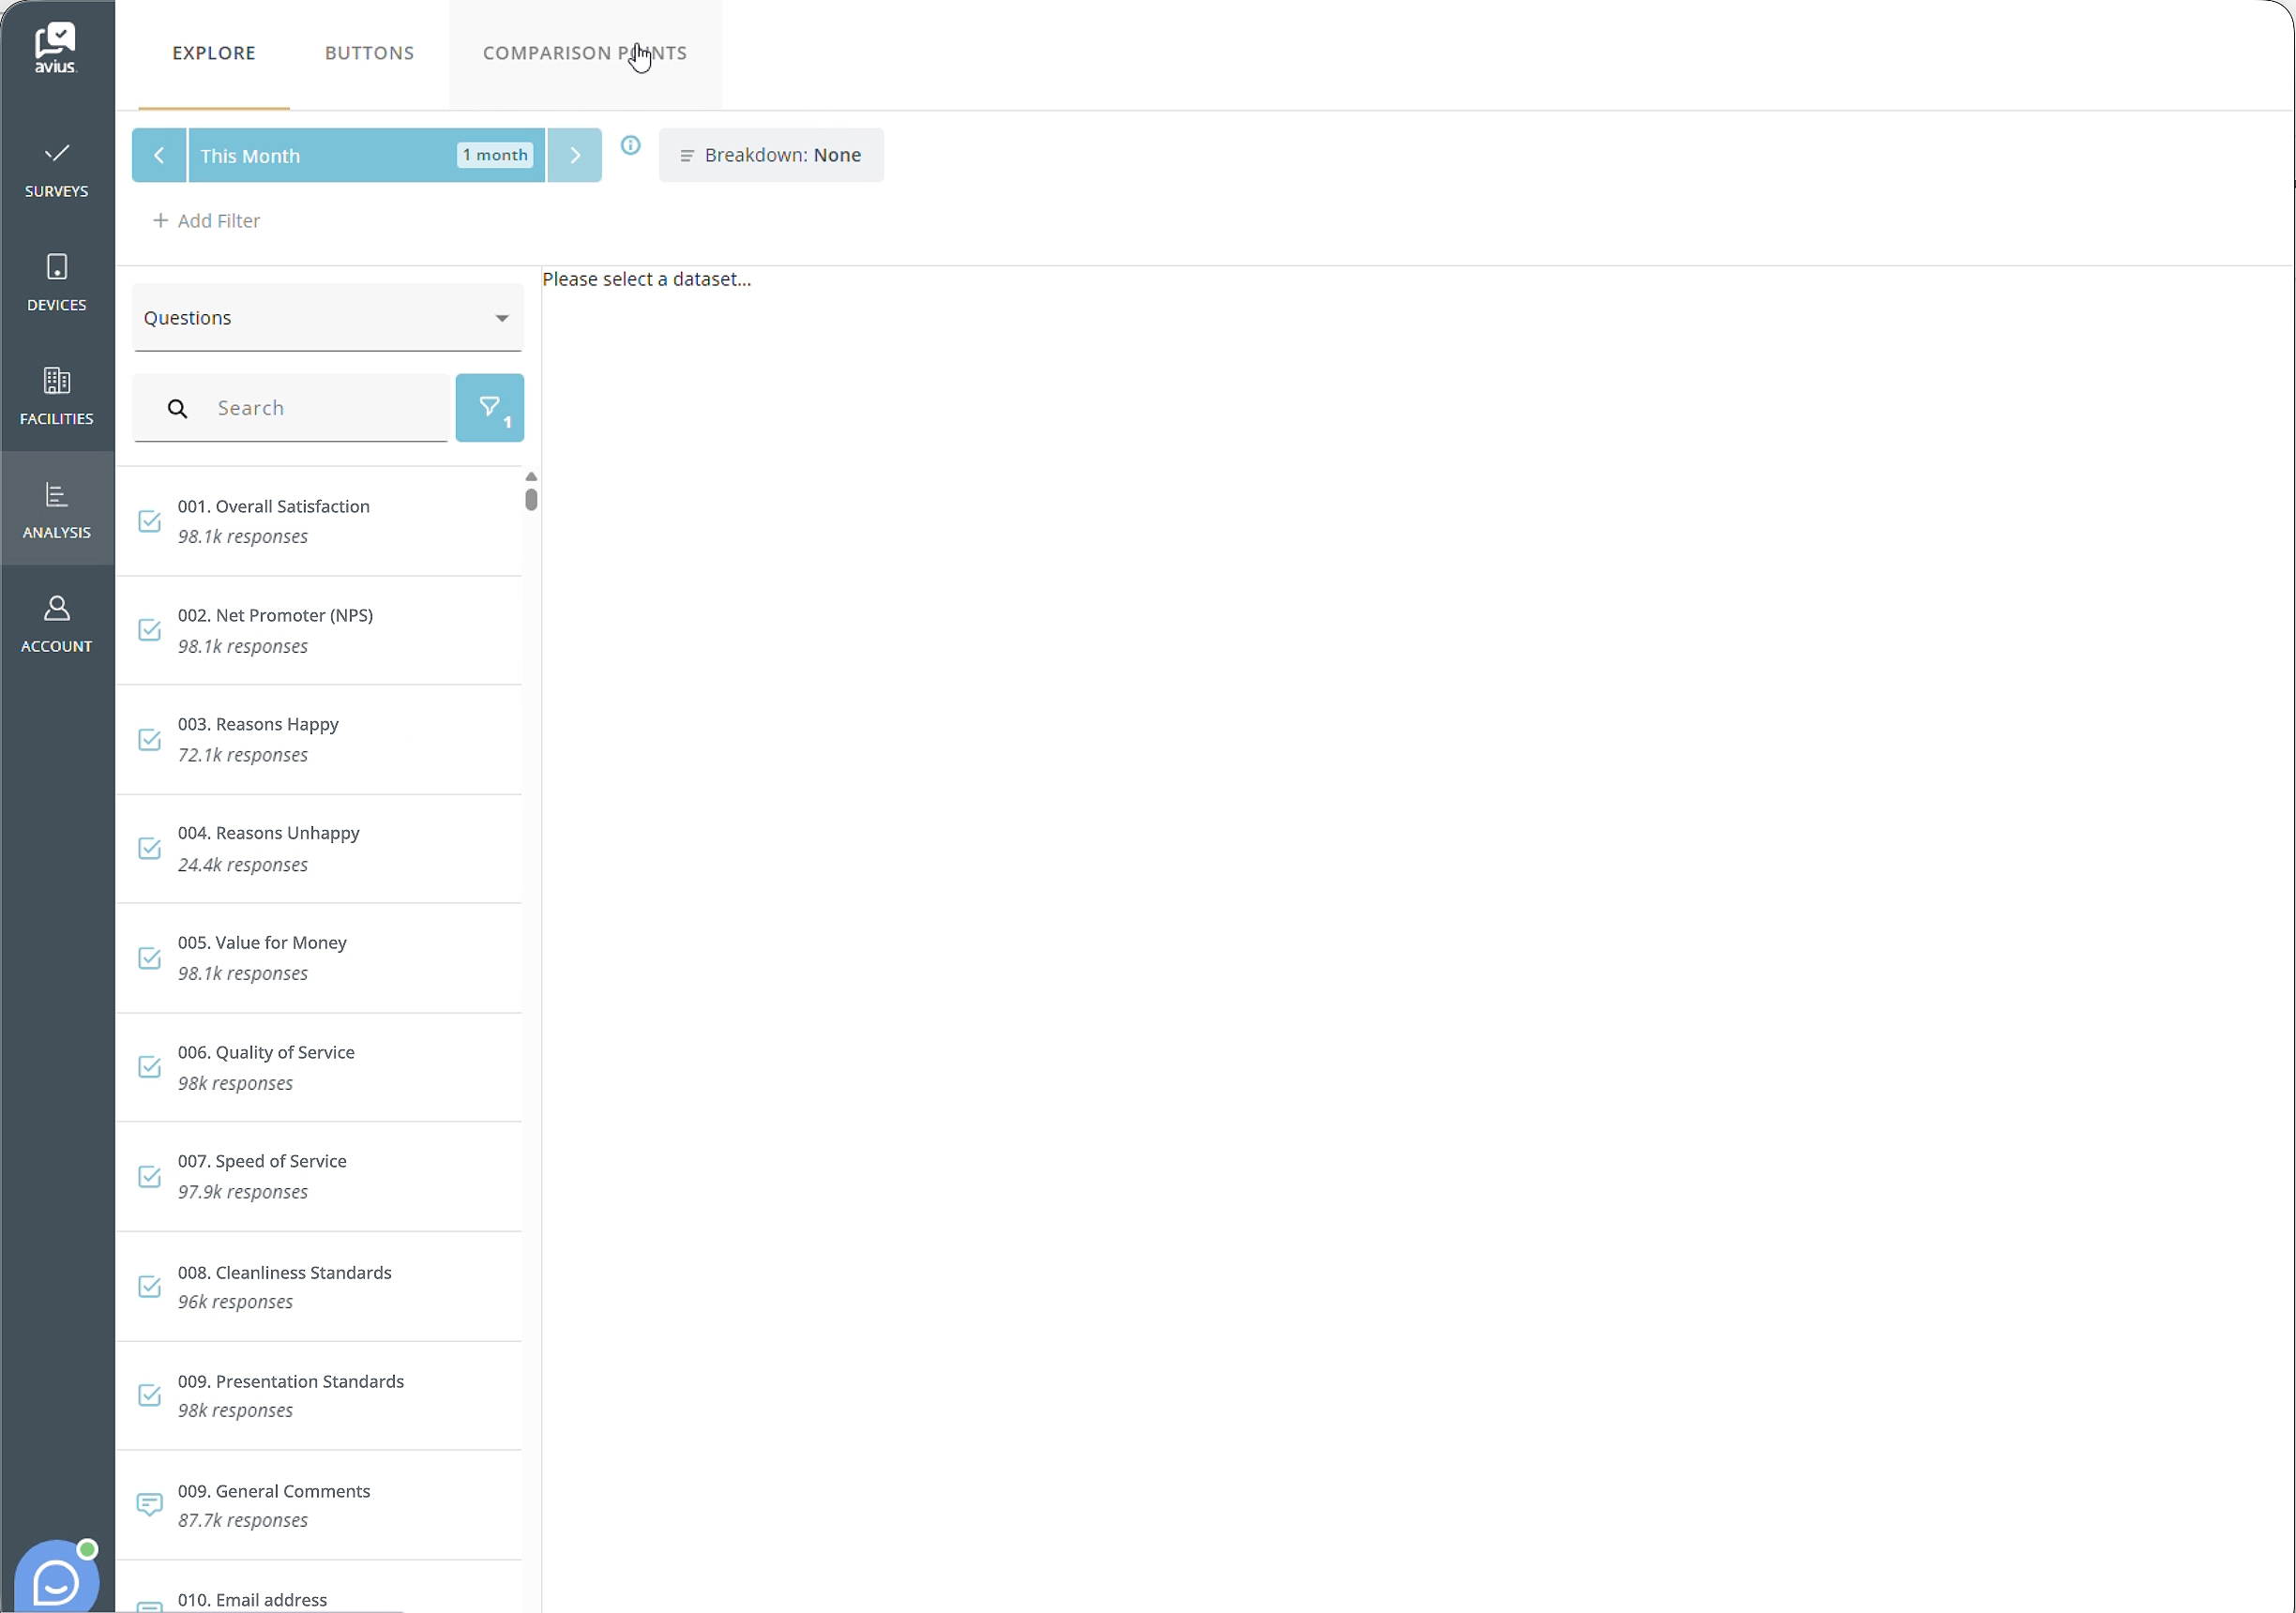
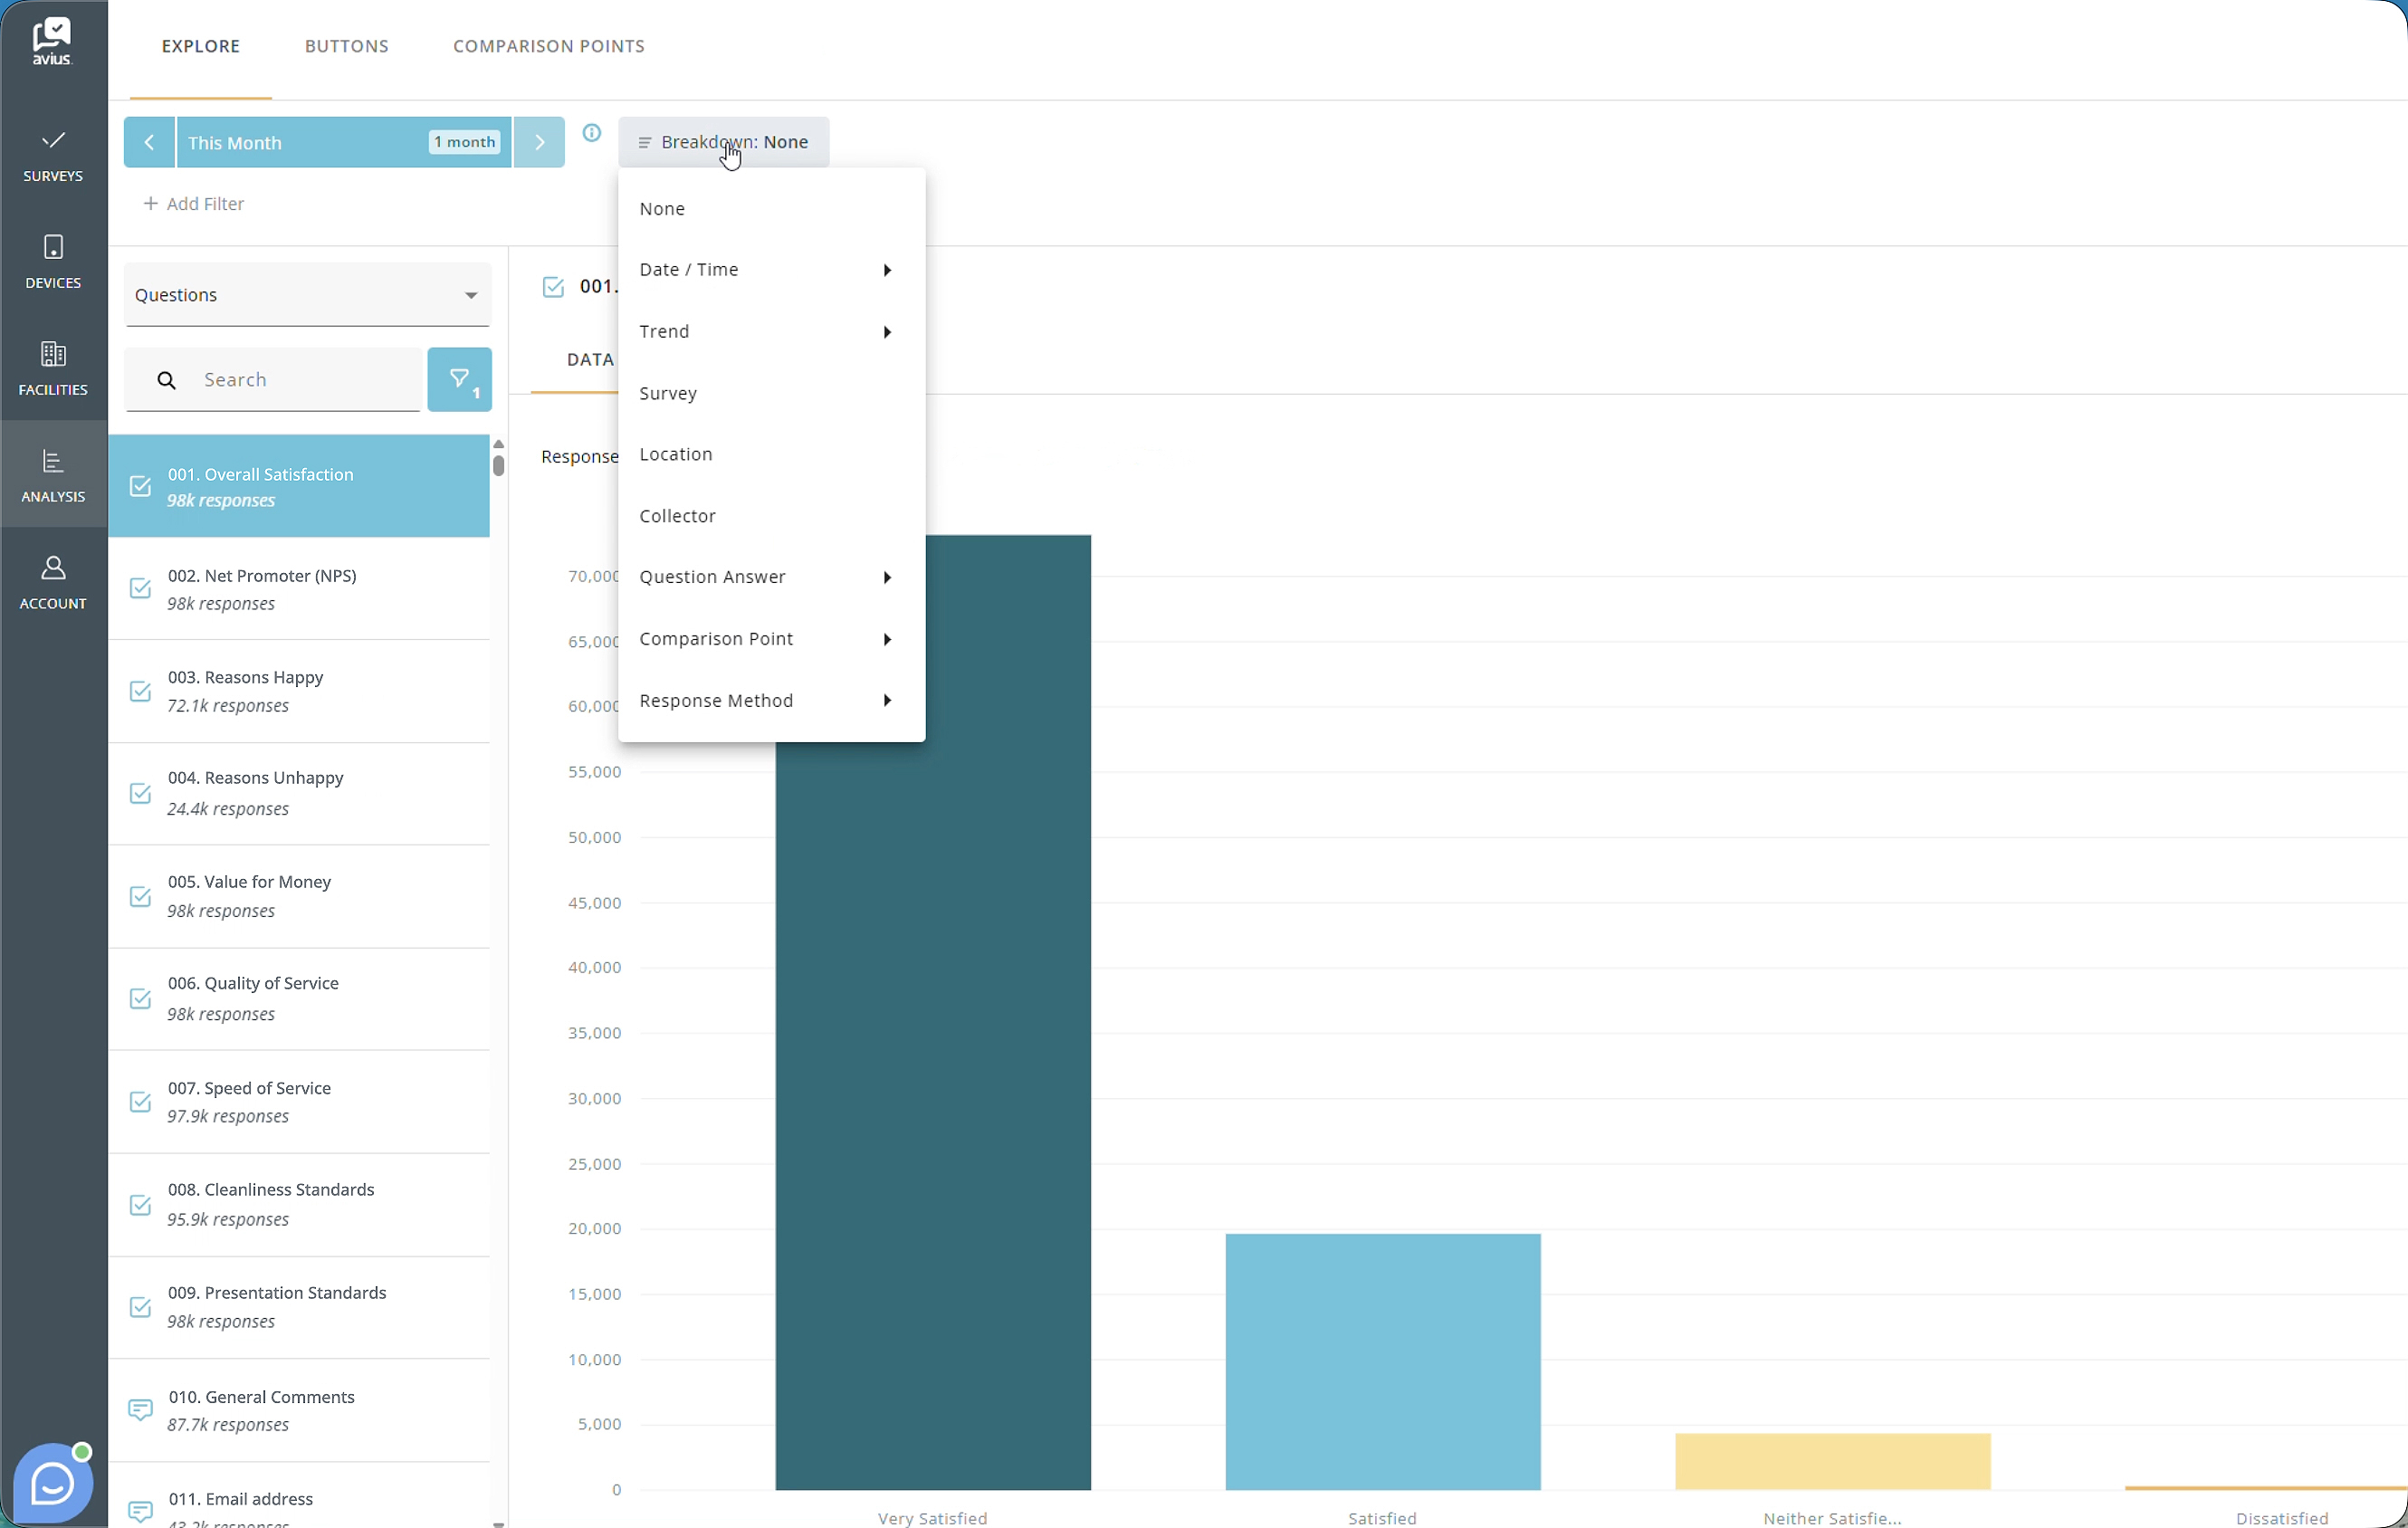
QUESTION BREAKDOWN
To break down your data by a survey question, click the Breakdown dropdown next to the date filter and select Question Answer.
Choose the question you want to analyse, then select the answers you would like to use for the breakdown. The data will be grouped based on the selected answer choices.
Click for more detail
Click for more detail
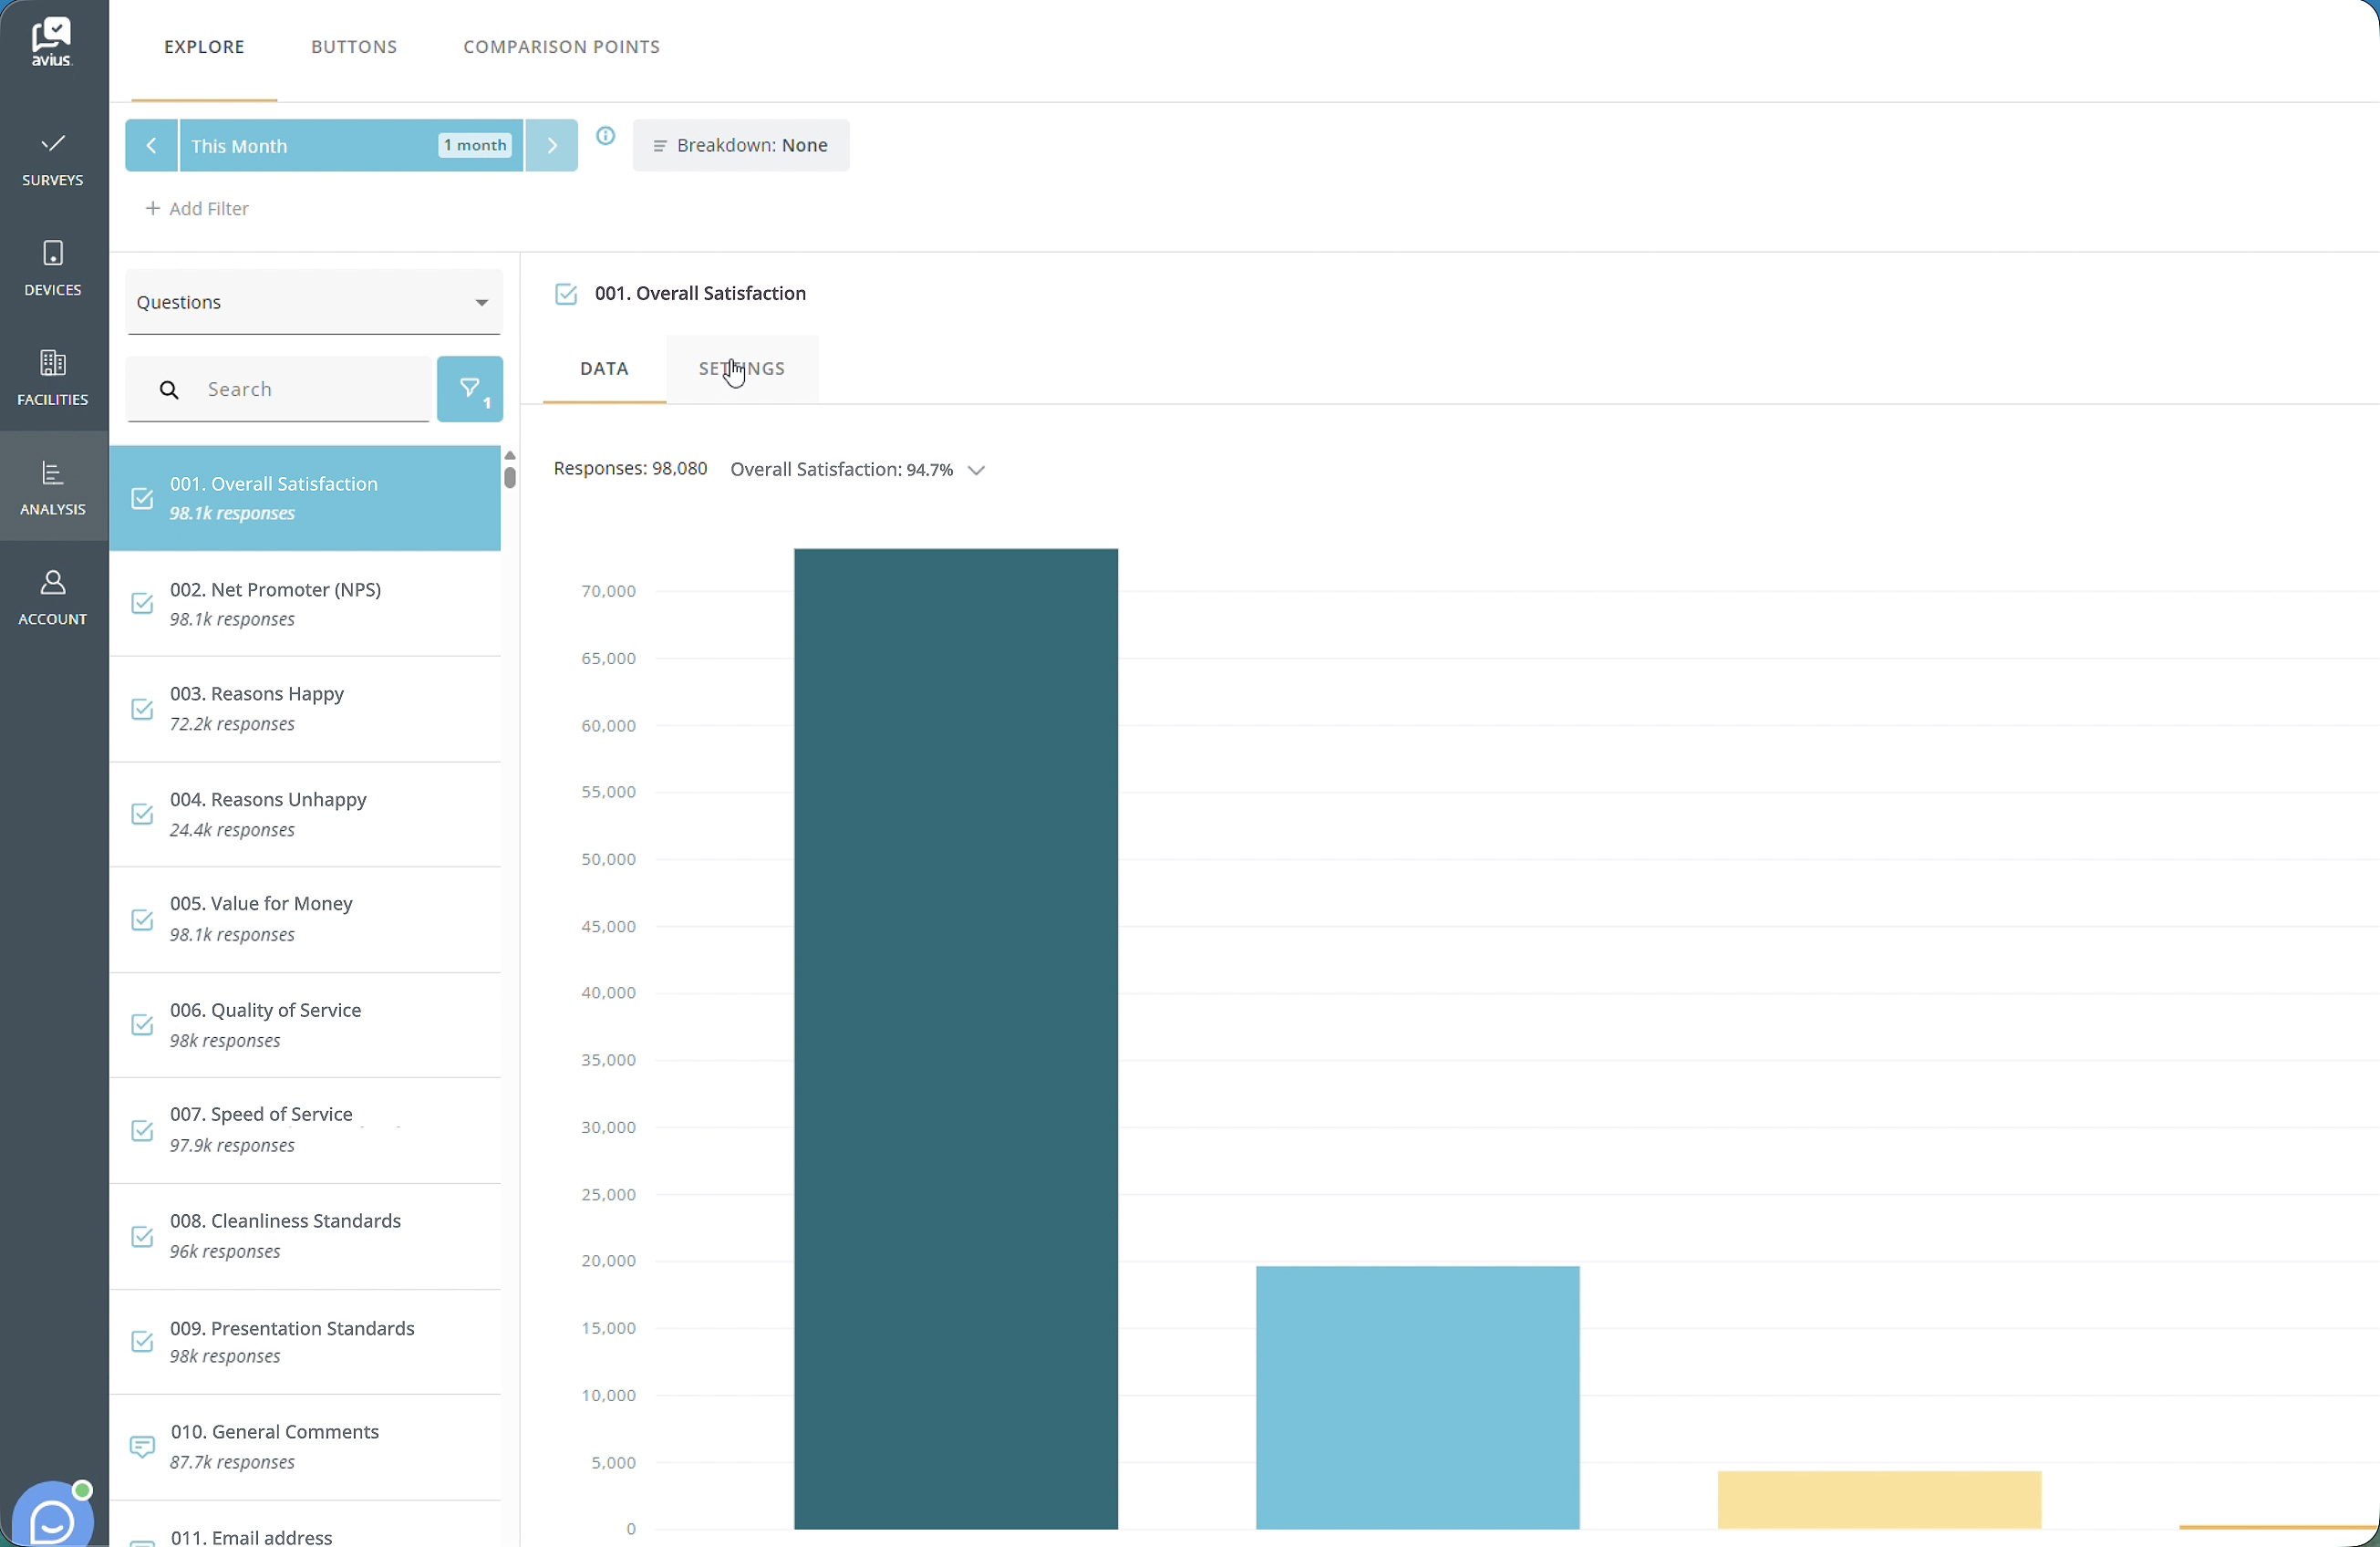
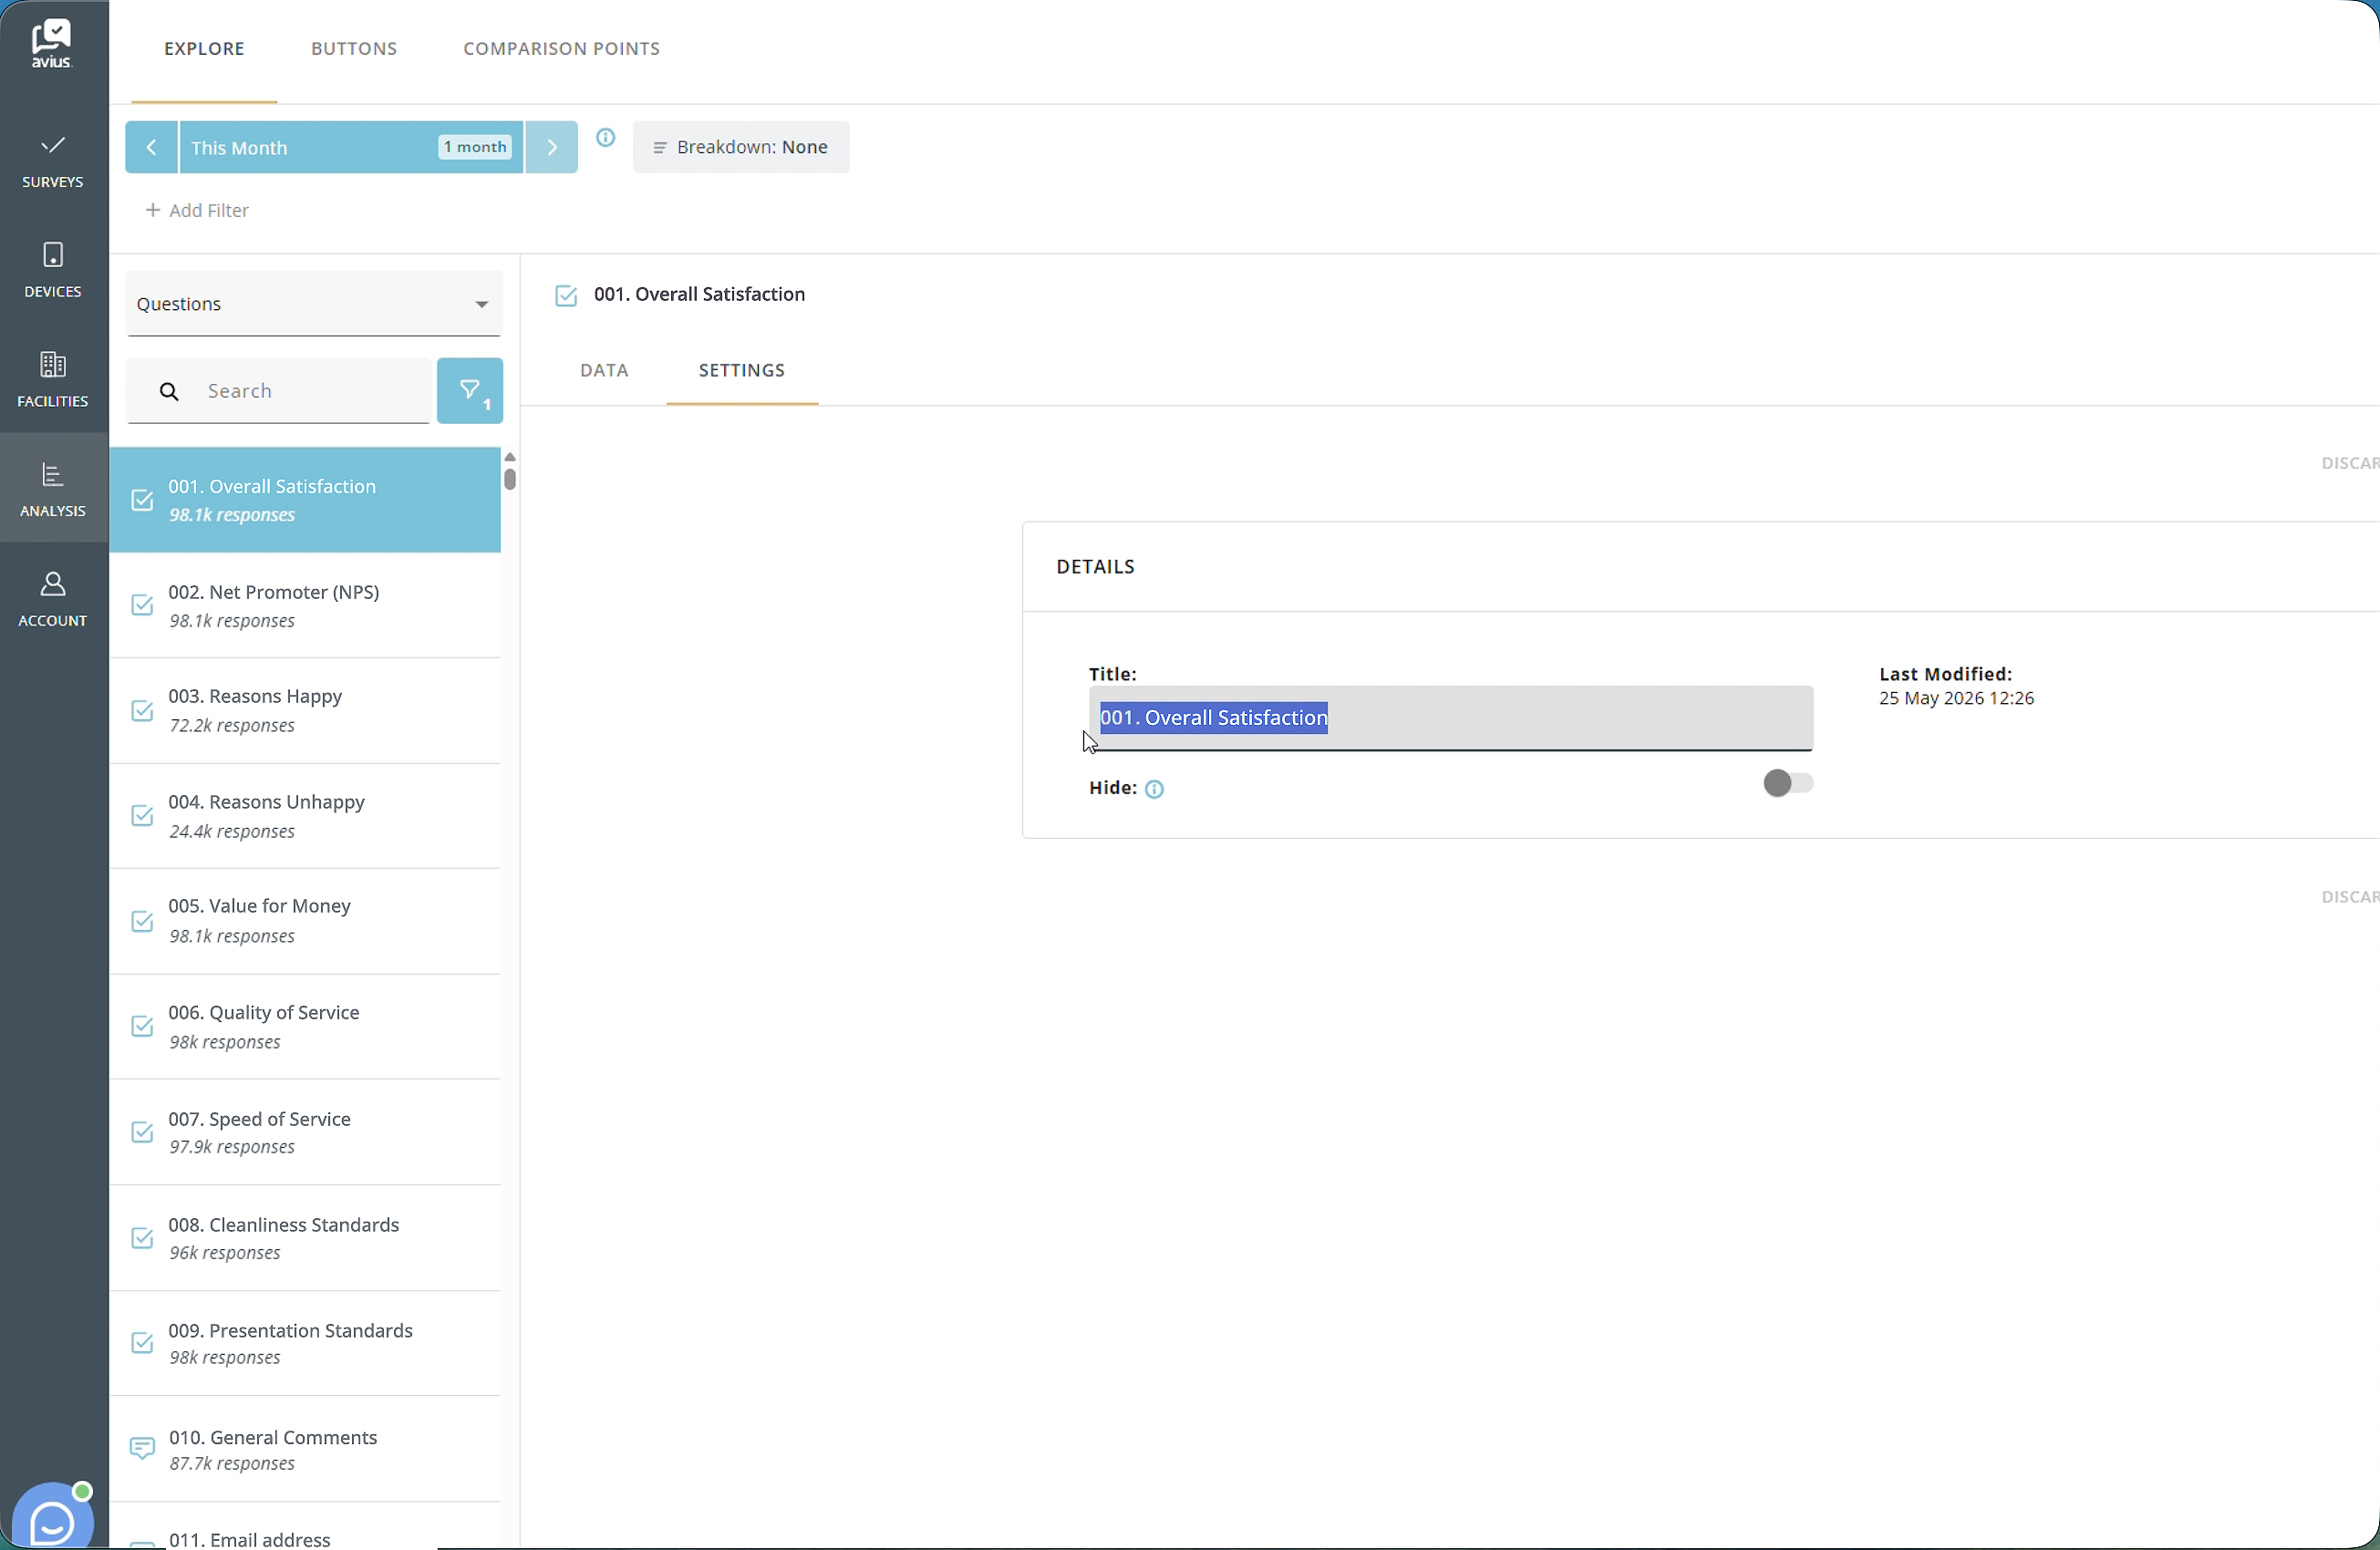
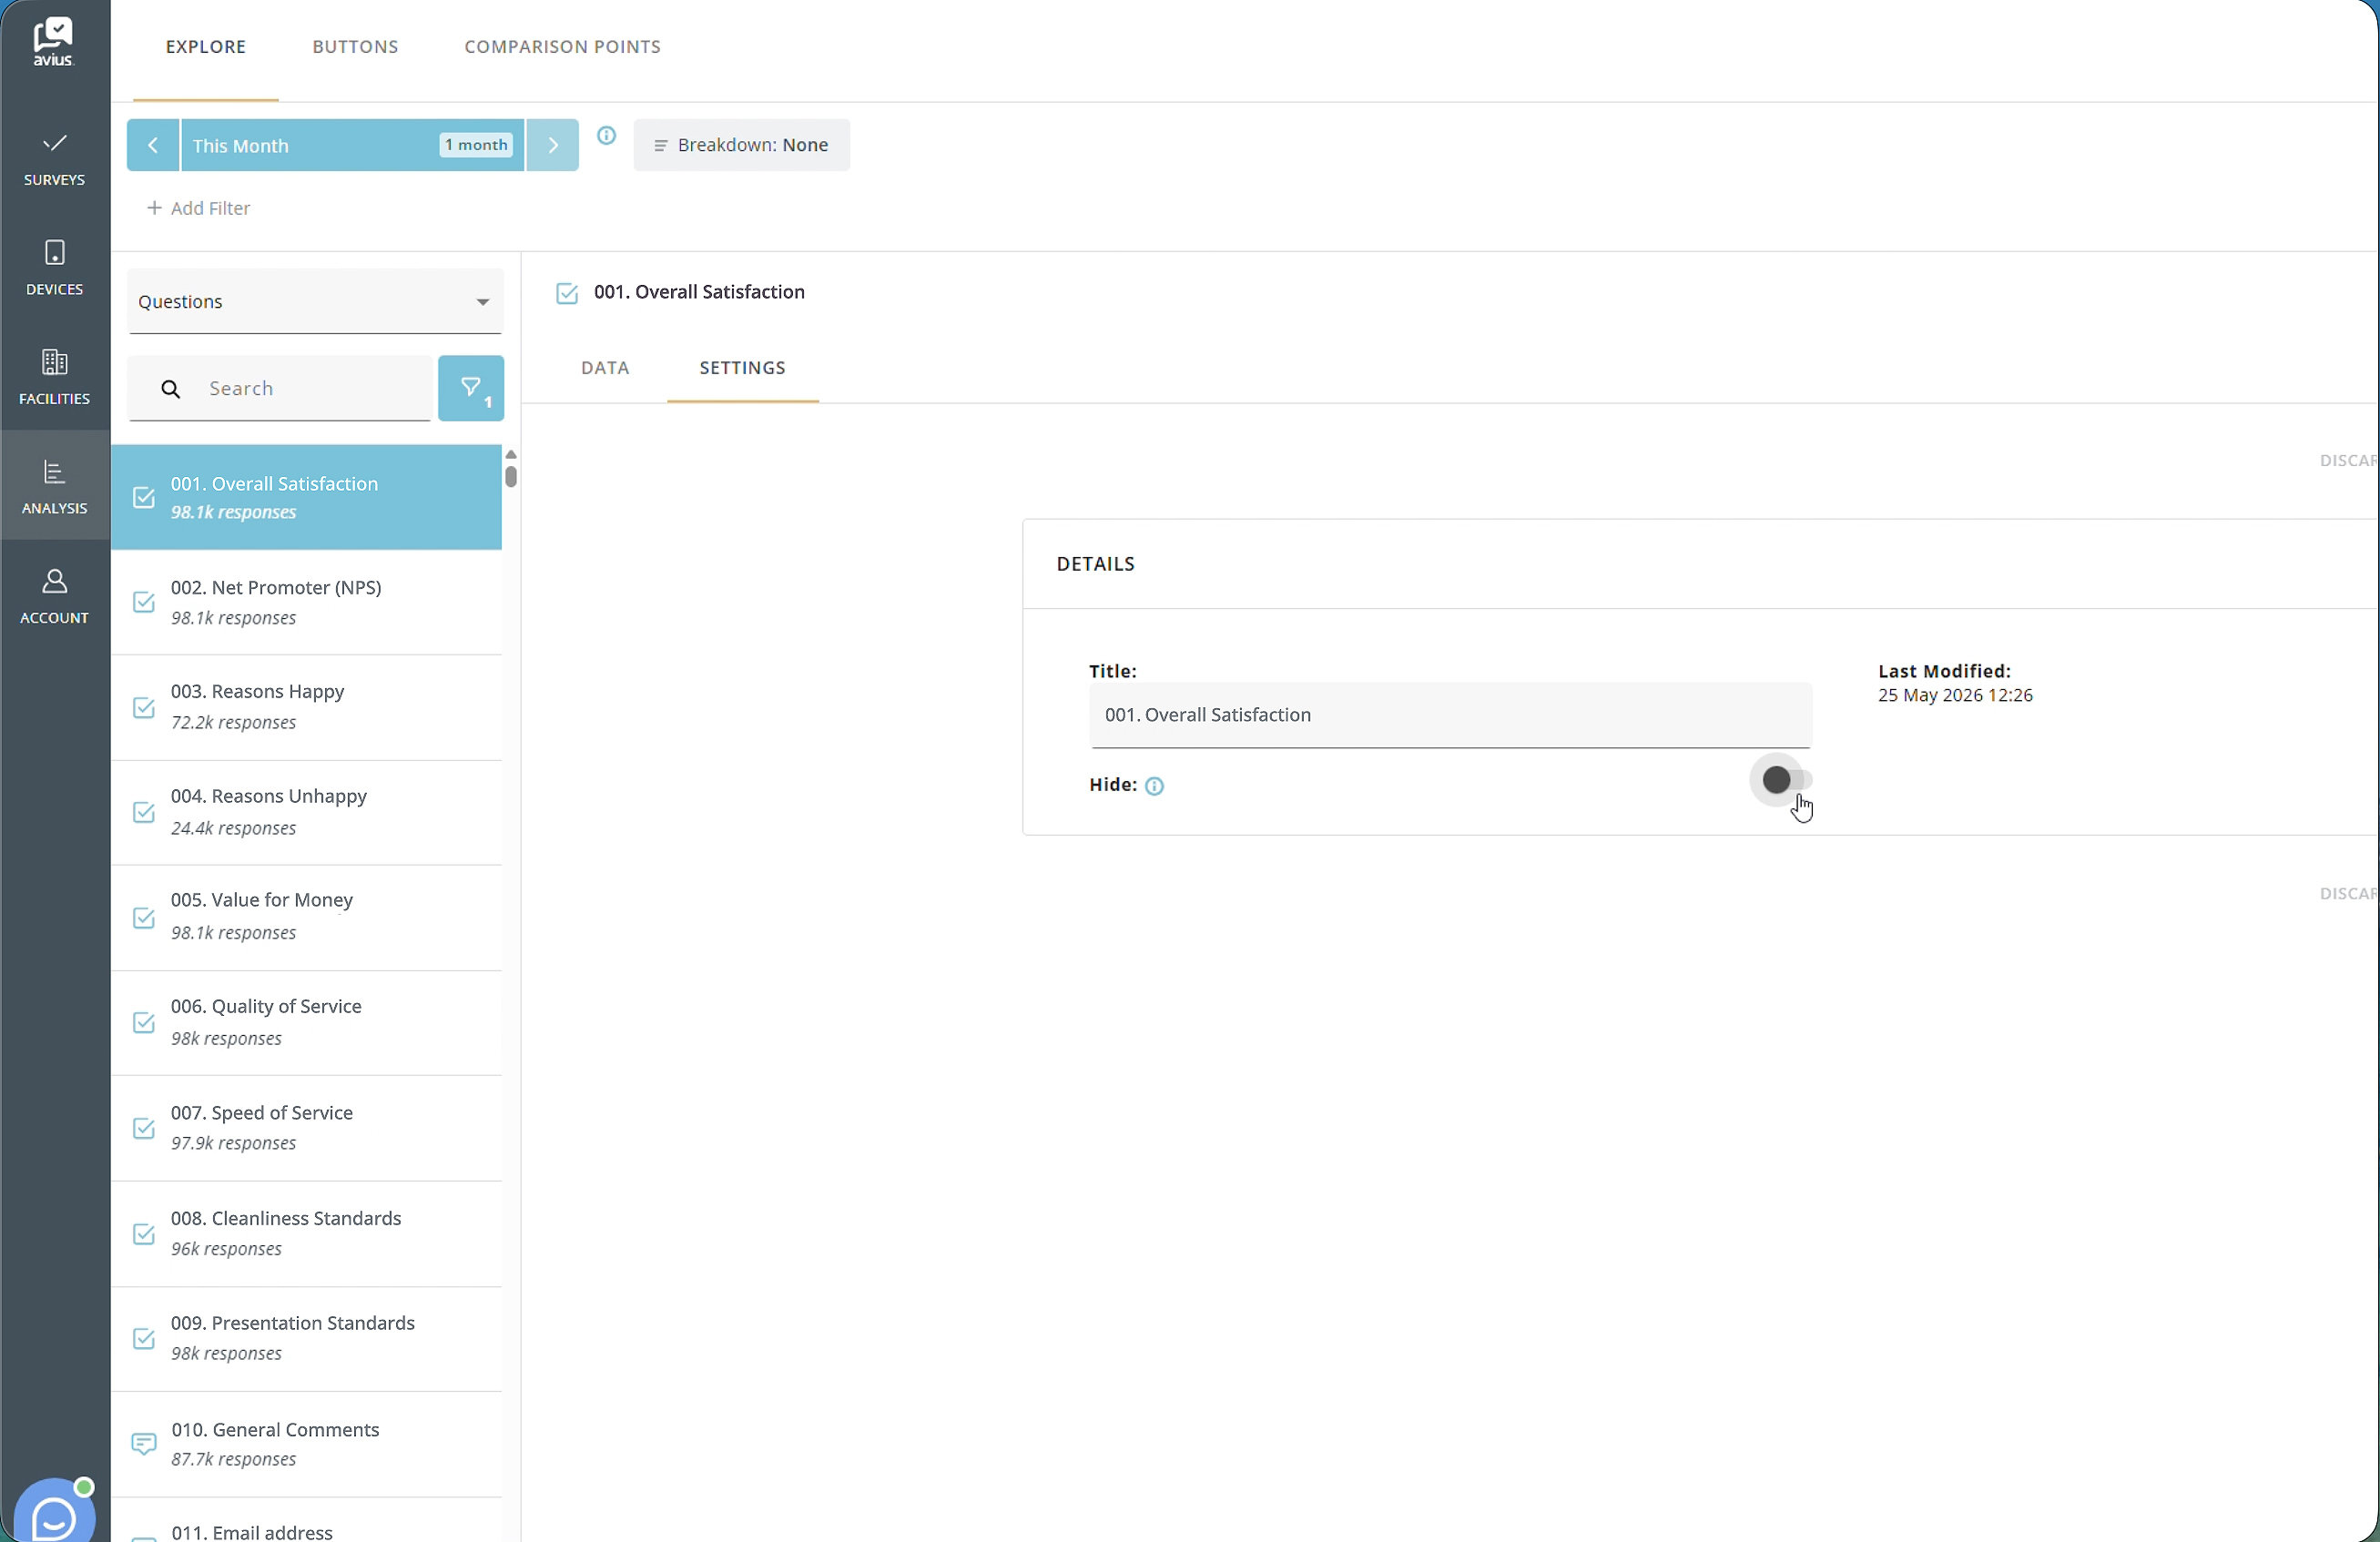
QUESTION SETTINGS
If your role is Manager, you can rename or hide questions within a survey using the Question Settings menu available for each question.
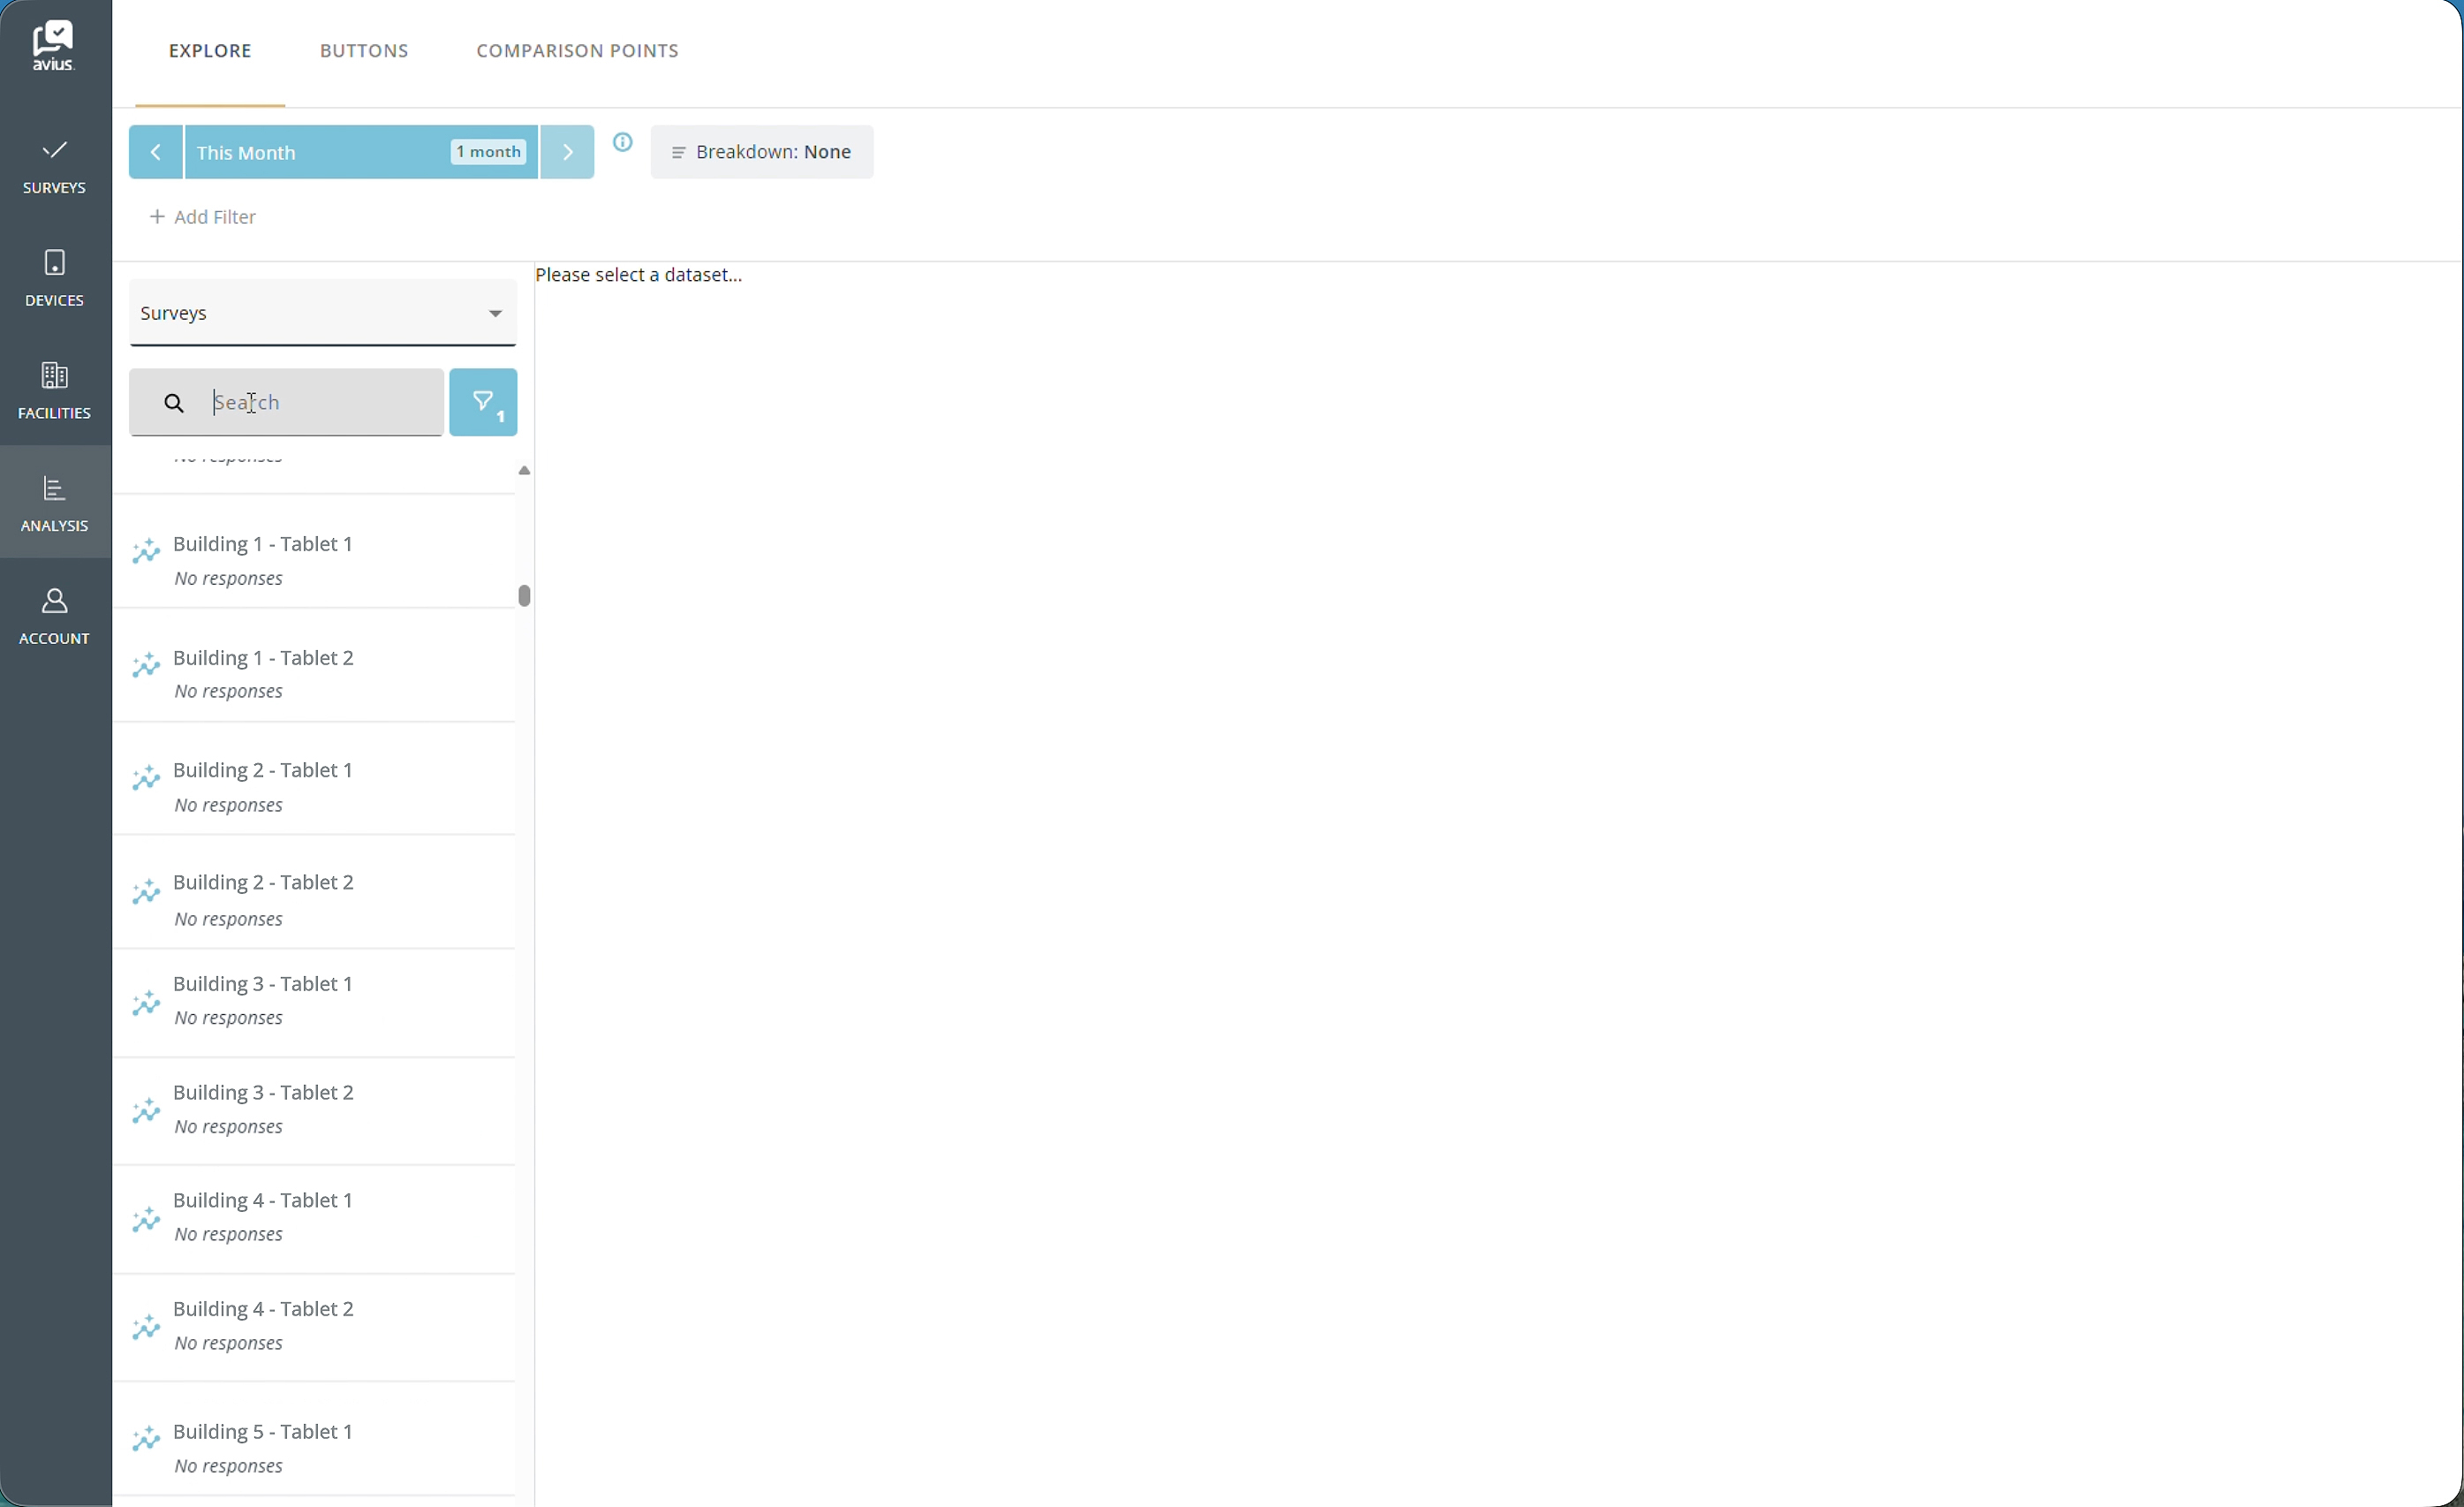
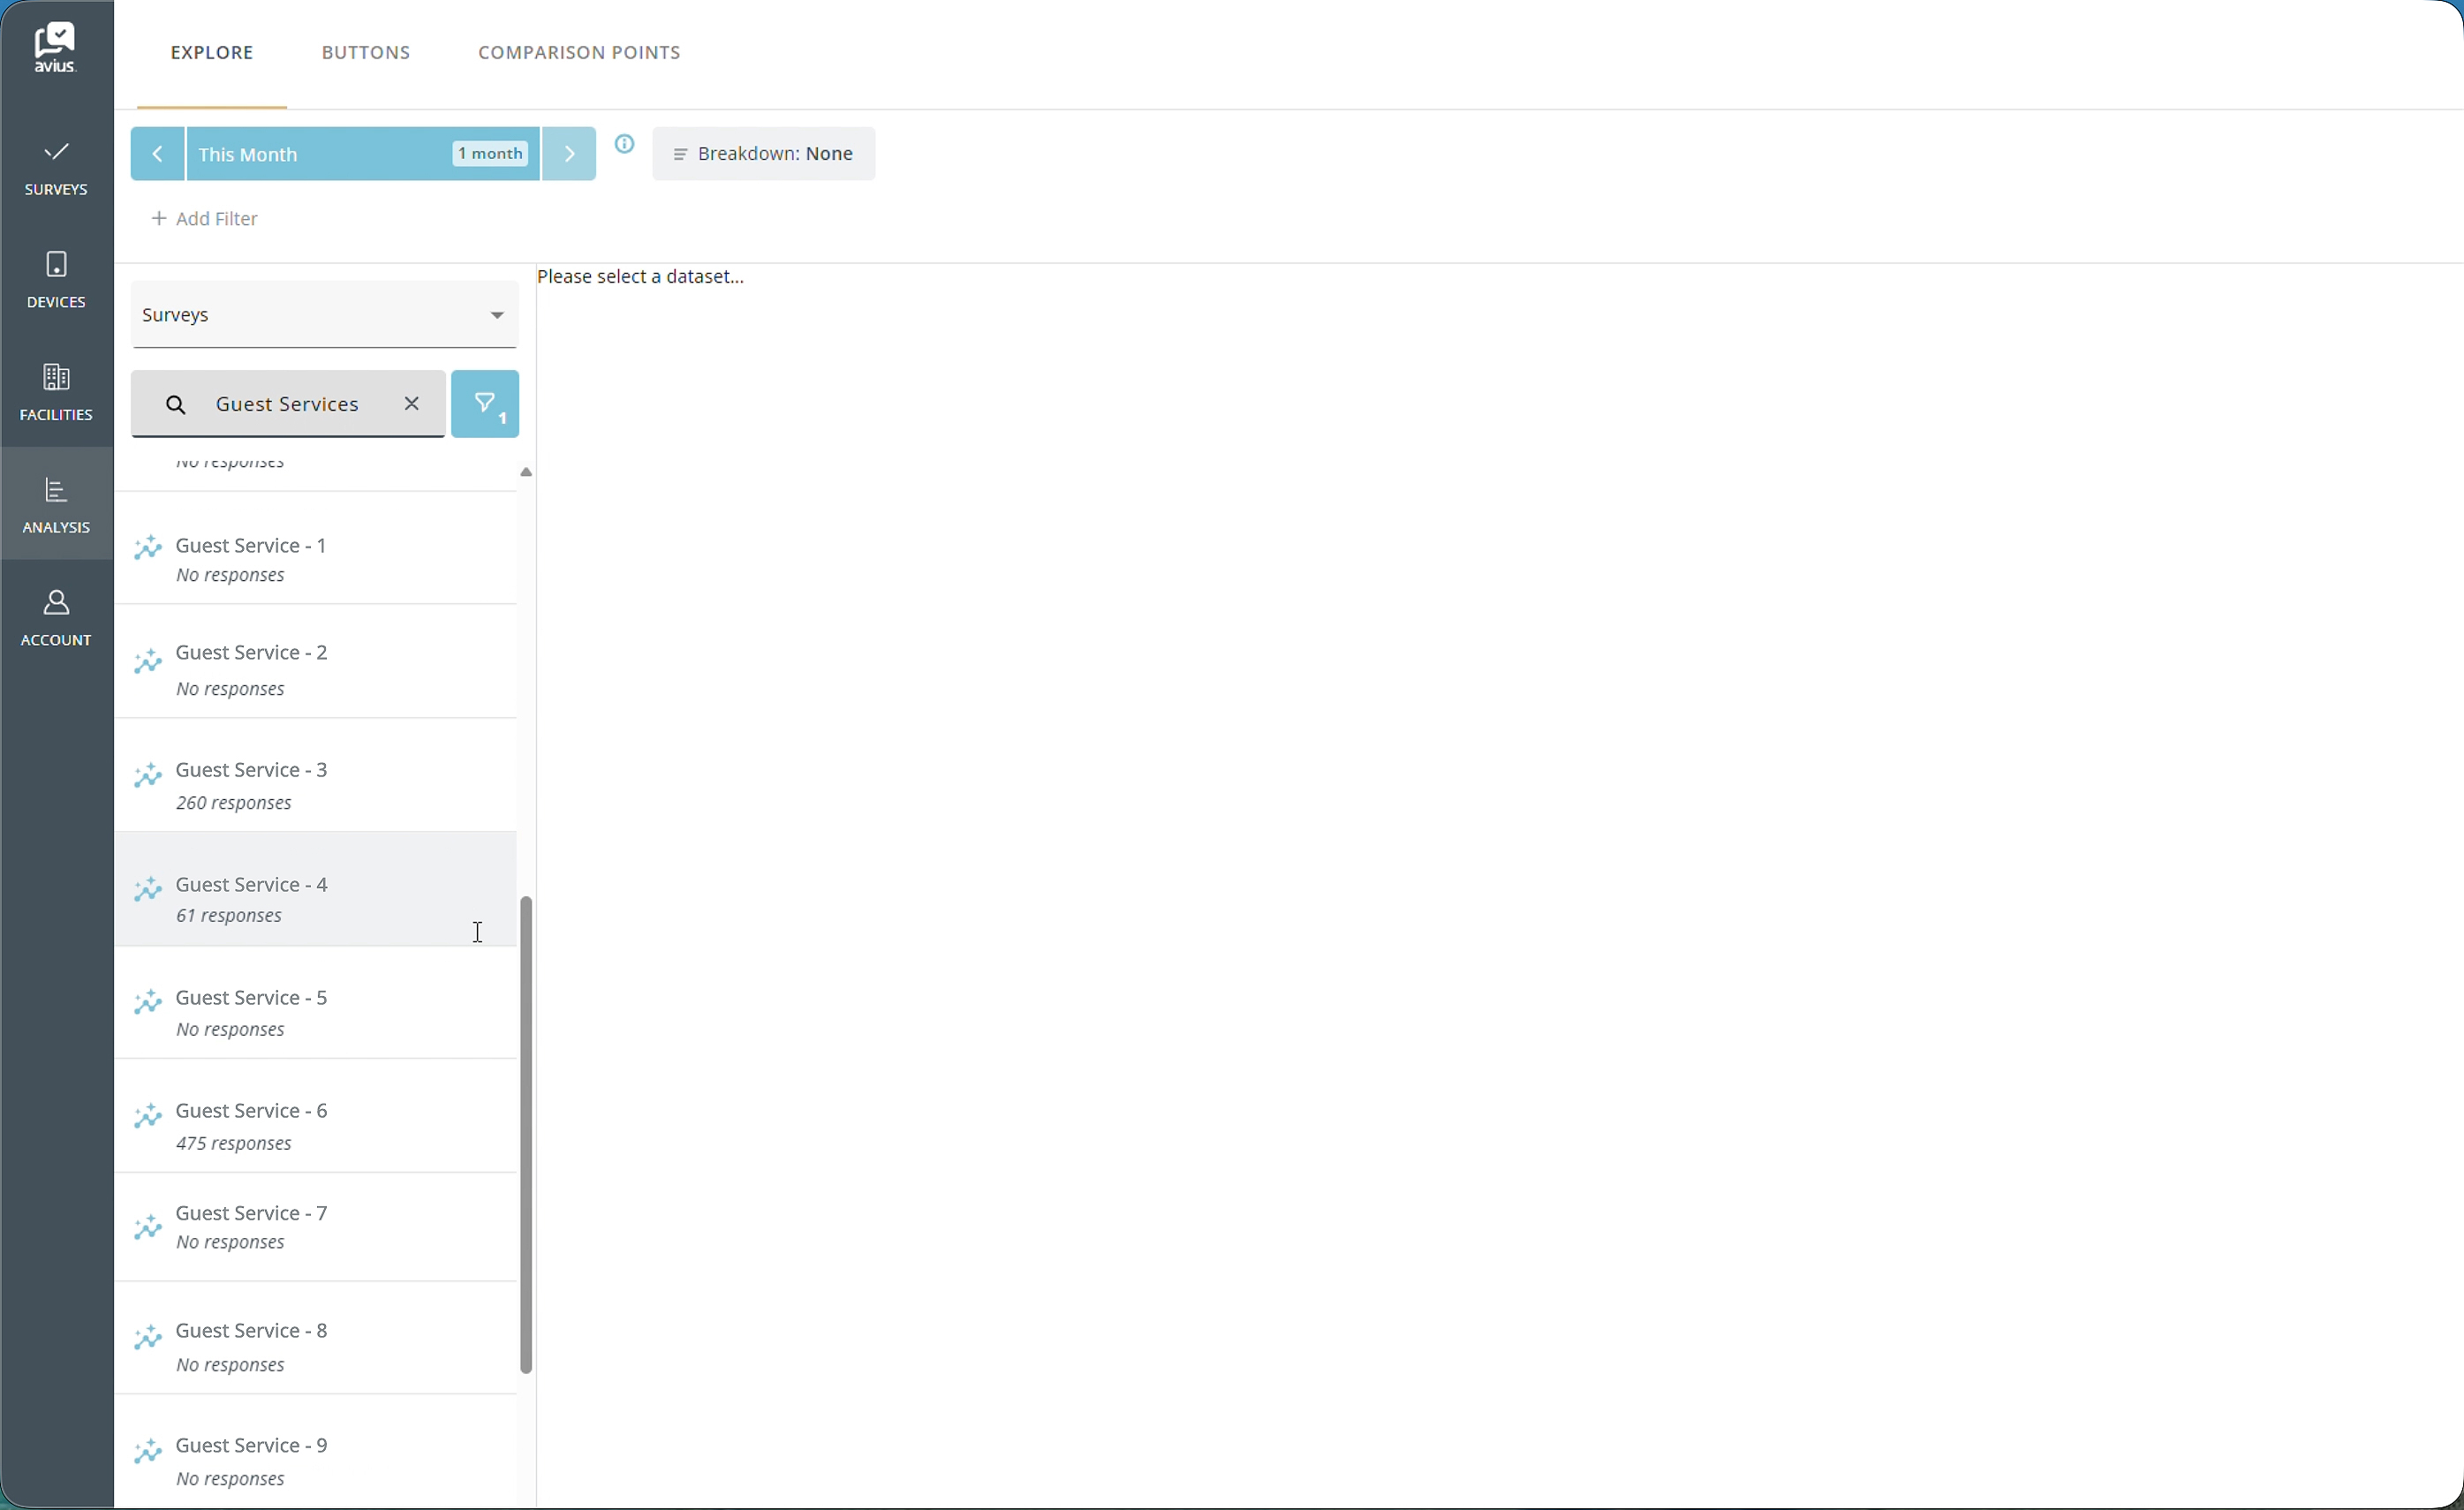
SEARCH BAR
The search bar allows you to quickly find specific data within your surveys. Simply type in your query and the results will be filtered in real-time, making it easier to locate the information you need.
Click for more detail